
AMD Stock Rebounds From $200 Support at 100-Day Average for Third Time
Advanced Micro Devices Inc. (AMD) bounced again after testing its 100-day moving average, repeating a pattern that’s worked several times recently. The stock found buyers near the $200–$205 zone, where this key technical line sits, and quickly pushed back toward $210. Each time AMD drops to this level, it seems to hit a floor and reverse higher.
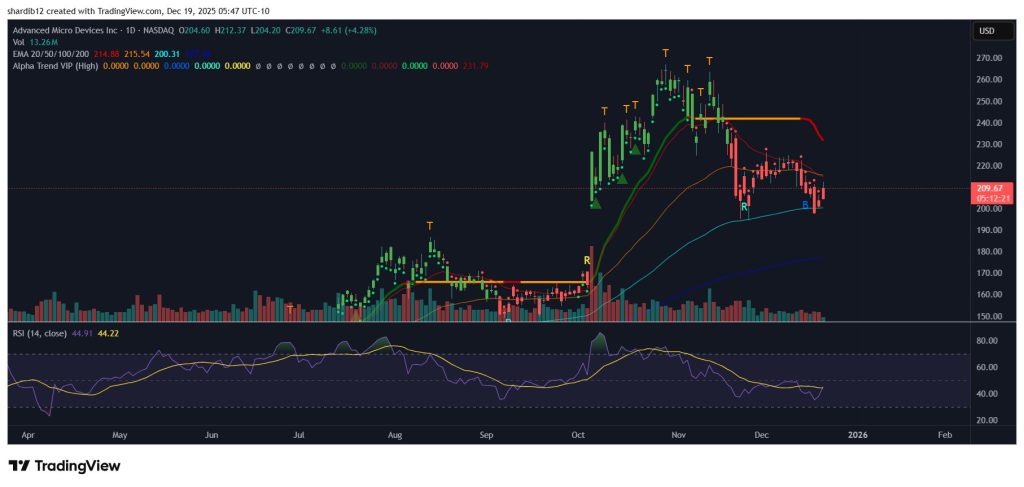
The recent pullback from higher prices brought AMD down to this support area, where momentum shifted. Sellers backed off as the stock touched the 100-day line, and buyers stepped in with enough force to create a visible reversal on the chart. The bounce wasn’t dramatic, but it was clean—price stopped falling and started climbing within a few sessions.
“The stock delivered a notable bounce from this level, repeating a pattern that has appeared multiple times during recent trading sessions.”
Looking at momentum indicators, the Relative Strength Index cooled into the mid-40s, showing neither overbought nor oversold conditions. Shorter-term moving averages have flattened after dipping, while the 200-day average remains well below current prices, confirming AMD still trades above its long-term trend. The technical picture suggests the stock is consolidating rather than breaking down.
What matters here is repetition. The 100-day moving average has become a reliable reference point for AMD’s price action over the past few weeks. Traders are clearly watching this level, and the stock’s repeated bounces show it’s holding as support. Whether this sets up another leg higher or just extends the consolidation depends on what happens around this zone in the next few sessions.
My Take: AMD’s respect for the 100-day average is textbook technical behavior. Three bounces from the same level don’t guarantee a fourth, but they do show where buyers are positioned. As long as this support holds, the path of least resistance stays upward.
Source: Haider