
Meta Platforms Inc. Stock Analysis: A Critical Juncture Ahead
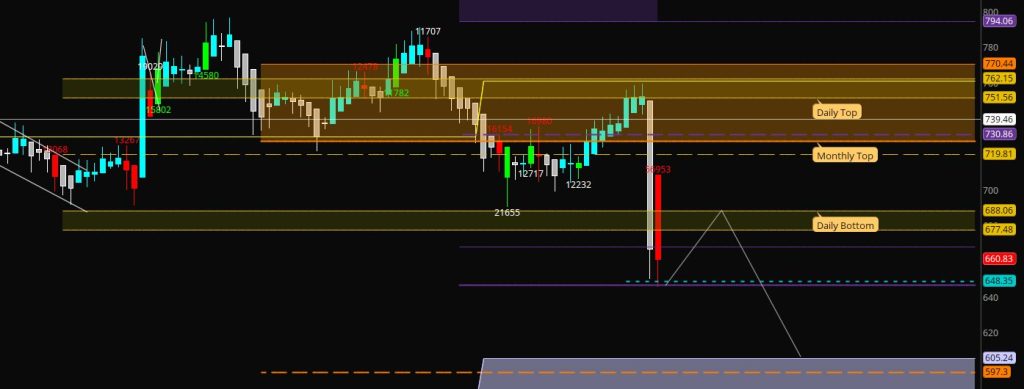
Meta Platforms ($META) is sitting at a pivotal moment. The chart reveals a few key scenarios: hold this level and Meta could climb back toward $688, break below it and $605 becomes the next target, or push above $700 and signal a full recovery.
Key Levels to Watch
According to trader Real Blonde Broker, the stock is testing a crucial support range between $648-$650—and what happens next could determine whether Meta bounces back or faces further downside.
Here’s what traders are focused on right now:
- $648-$650 support zone — Meta is testing this range now. If it holds, expect a bounce toward $688. If it fails, $605 is the next stop.
- $688 resistance — A level Meta has struggled with before. Breaking through here would be a bullish sign.
- $605 downside target — If support cracks, this is where the stock could land next, especially if broader market conditions weaken.
- $700 breakout level — Reclaiming and holding above this price would confirm the bottom is in and set the stage for a sustained recovery.
The chart also shows a bearish RSI divergence, meaning momentum is weakening even as price tries to rally—suggesting caution in the near term. Volume spikes during key moves will help confirm whether any breakout or breakdown is for real.
What’s Influencing Meta Right Now?
A few things are weighing on the stock. Broader market volatility is a big factor—if tech takes a hit, Meta usually follows. Earnings results also matter a lot; any surprises (good or bad) could swing the stock significantly. And with competition heating up from Apple, Google, and others, Meta’s growth story is constantly being reassessed by investors.