
XRP Shows Bullish Divergence as Analyst Signals Potential Reversal
XRP continues to face downward pressure across the market, but recent analysis highlights a potential shift in momentum. The latest chart update shows a significant bullish divergence forming on the daily timeframe, hinting at a possible reversal after extended weakness. XRP is trading near 2.11 while price action remains positioned against long-term support zones that have repeatedly influenced direction throughout 2024 and 2025.
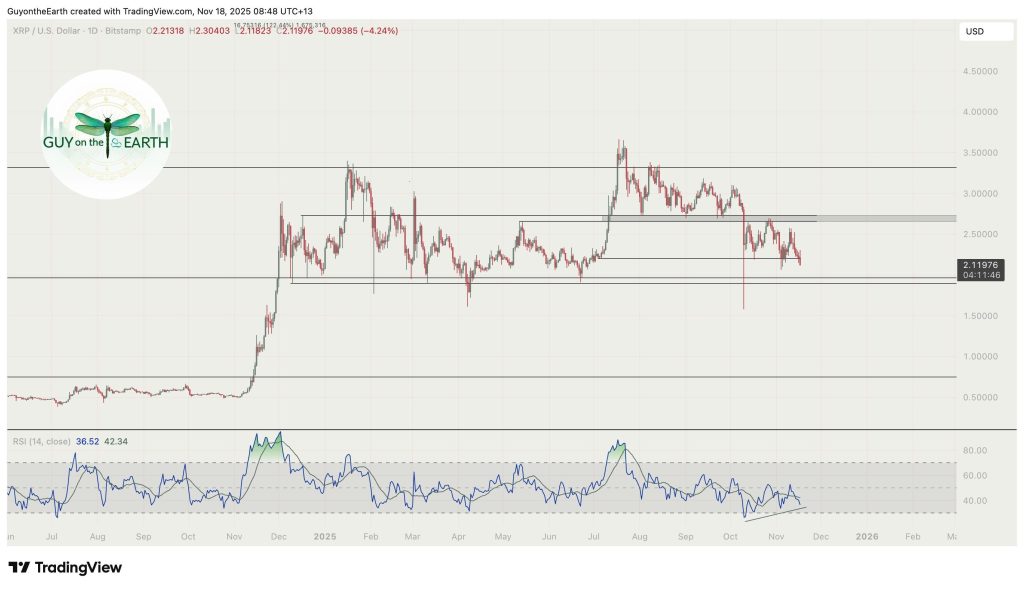
The chart displays several horizontal support and resistance regions, with XRP currently holding near the lower boundary of a broad range between 1.50 and 3.50. Price has moved sideways within this structure for months. While XRP has formed lower lows, the RSI indicator has been recording higher lows, creating what’s described as a massive bullish divergence. This setup mirrors prior conditions on the chart where momentum recovery began following similar RSI behavior.
Recent market action also shows XRP testing an area that historically produced strong reactions during earlier rallies and mid-range consolidations. The RSI line on the chart is clearly trending upward despite price declines, supporting the idea that momentum may be stabilizing. While the outlook doesn’t assign a specific target, the analysis emphasizes that the broader technical structure remains intact and that this divergence could mark the early stages of a momentum shift.
This development adds to the wider discussion around XRP’s medium-term trend as participants watch for signs of renewed strength. With XRP trading at a key support area and a bullish divergence emerging on the RSI, upcoming market sessions could play an important role in shaping sentiment. The combination of structural support and improving indicator behavior adds weight to the current technical picture.
source: Walter Bloomberg