Gold Price Poised for Historic Rally Through 2028 as Multi-Decade Channel Holds Strong
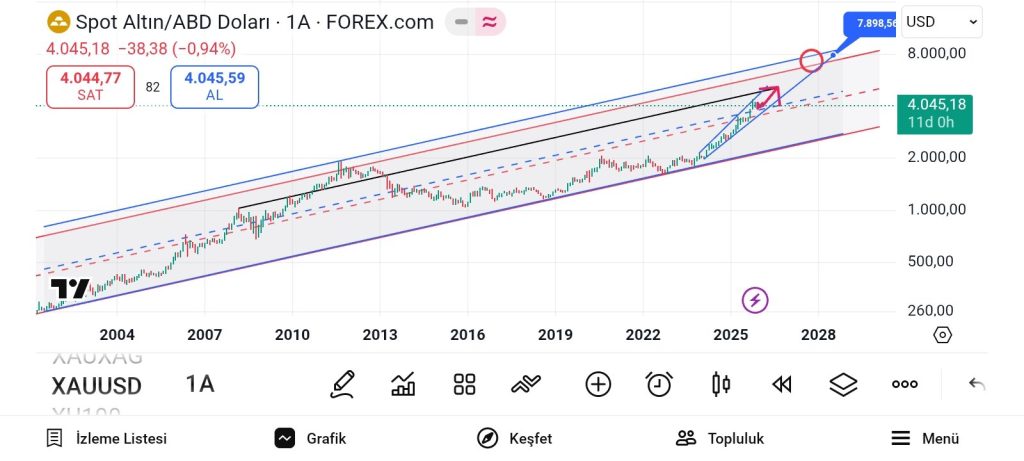
Gold’s remarkable structural integrity continues to captivate technical analysts and long-term investors as the precious metal maintains its position within a multi-decade ascending price channel that has guided market behavior since the early 1970s. Trading at approximately $4,045, spot gold (XAUUSD) currently sits well above the channel’s midpoint, reinforcing a bullish framework that has withstood numerous economic cycles, policy shifts, and market disruptions over nearly five decades.
Technical Foundation Spanning Five Decades
The long-term chart reveals a disciplined price corridor that has contained gold’s major movements through multiple generational cycles. From its positioning near the lower boundary during the early 2000s, the metal has systematically advanced toward the upper trend line through successive waves of accumulation and expansion. This isn’t simply a matter of drawing retrospective lines on a chart—the channel has repeatedly proven its relevance by catching major turning points and providing meaningful structural guidance during both advances and corrections.
What makes this technical pattern particularly compelling is how gold has historically treated the channel boundaries as actionable zones. Major pullbacks, including those that seemed severe in real-time market conditions, consistently found support at or near the lower boundary before initiating renewed advances. The extended consolidation period between 2013 and 2019, often cited as evidence of gold’s stagnation, now appears in proper context as a natural pause within the channel rather than a structural breakdown.
Current Cycle Dynamics and Future Trajectory
The acceleration phase that began in the 2020s represents a familiar pattern within gold’s cyclical behavior. Sharp advances out of consolidation zones have historically preceded sustained moves toward the upper portions of the channel, and current price action suggests this cycle remains in full force. The projected path indicated by technical analysis points toward potential interaction with the upper resistance zone near $7,800, a target that would represent a continuation of the structural trend rather than an anomalous breakout.
Cycle analysis reinforces this outlook by identifying gold’s position within the broader expansion phase of its long-term pattern. Historical precedent shows that these phases, while punctuated by corrections and temporary consolidations, maintain their directional bias until price approaches the upper boundary of the established channel. The current positioning at $4,045 suggests substantial room for continuation within the existing framework, particularly as macroeconomic conditions continue to support safe-haven asset demand.
Source: mühendisborsa