
SEI Price Analysis: Token Eyes 400% Rally as Double Bottom Pattern Takes Shape
SEI is exhibiting early characteristics of a double-bottom formation, a bullish reversal pattern that often signals the end of downtrends and the beginning of new upward cycles. Currently trading around $0.16 after declining 1.34%, the token has stabilized near its multi-month low, suggesting that selling pressure may be exhausting itself.
The pattern has developed over an extended timeframe, with the first trough forming in March 2025 and the second taking shape in November. This eight-month base represents significant accumulation at lower prices, a development that technical analysts view as constructive for future price appreciation.
Critical Resistance Level Holds Key to Breakout
The neckline of this potential double-bottom sits between $0.34 and $0.38, marking the zone where SEI rallied between its two lows. This resistance area represents the most important technical hurdle for bulls attempting to reverse the long-term trend.
According to technical analyst Ali, a confirmed breakout above this neckline could trigger a measured move toward $0.70—representing approximately 340% gains from current levels. This target derives from the classical double-bottom calculation, which projects the distance from the lows to the neckline upward from the breakout point.
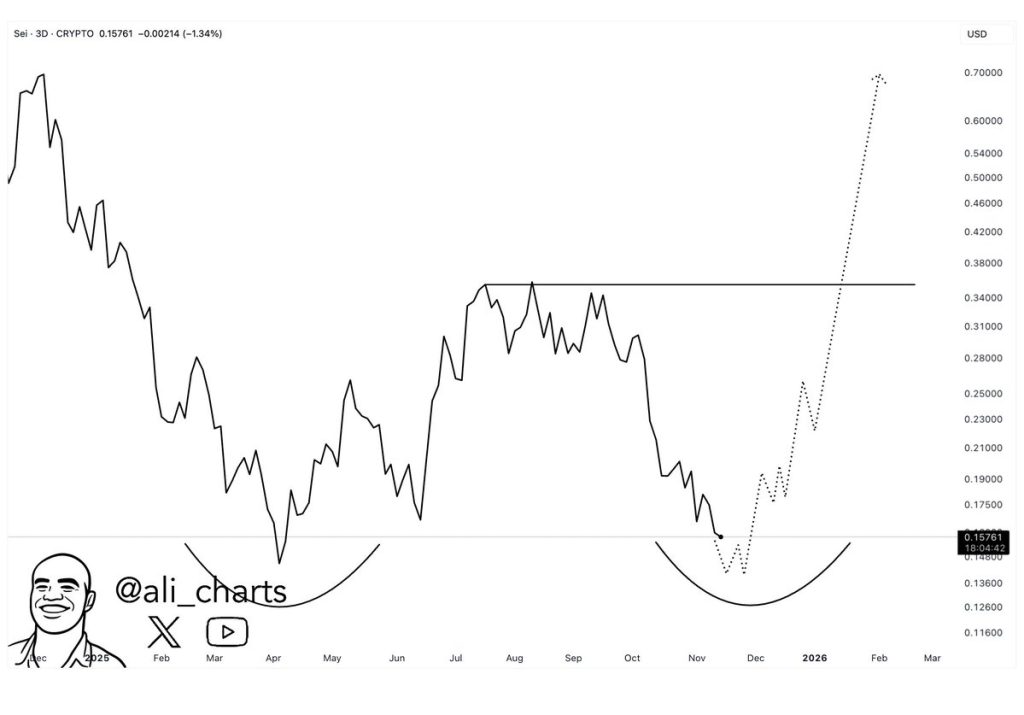
The projected path outlined in technical charts shows a series of ascending waves rather than a straight-line rally, reflecting the typical volatility patterns seen during major trend reversals. This suggests traders should anticipate periods of consolidation and pullbacks even if the breakout materializes.
What Makes This Pattern Significant
Double-bottom formations carry weight in technical analysis because they represent fundamental shifts in market psychology. The pattern signals that buyers have repeatedly defended a price level, absorbing selling pressure and establishing a floor beneath which the asset refuses to fall.
For SEI, the extended timeframe of this formation—spanning from early spring through late autumn—adds credibility to the pattern. Multi-month bases often precede sustained rallies because they allow sufficient time for speculative positions to unwind and for new accumulation to occur at depressed valuations.
The symmetry between the two lows also strengthens the technical case. Both troughs occurred near the $0.16 region, demonstrating consistent demand at this level across different market conditions and time periods.
Source: Ali