SEI Price Analysis: Bullish Triangle Formation
- The SEI/USD 4-hour chart displays a descending trendline connecting five lower highs. Despite multiple rejections, each pullback has formed higher lows—indicating weakening selling pressure. Price briefly dropped below the $0.175 support level, creating a bullish deviation before reclaiming it. This type of move often signals accumulation and renewed buying interest.
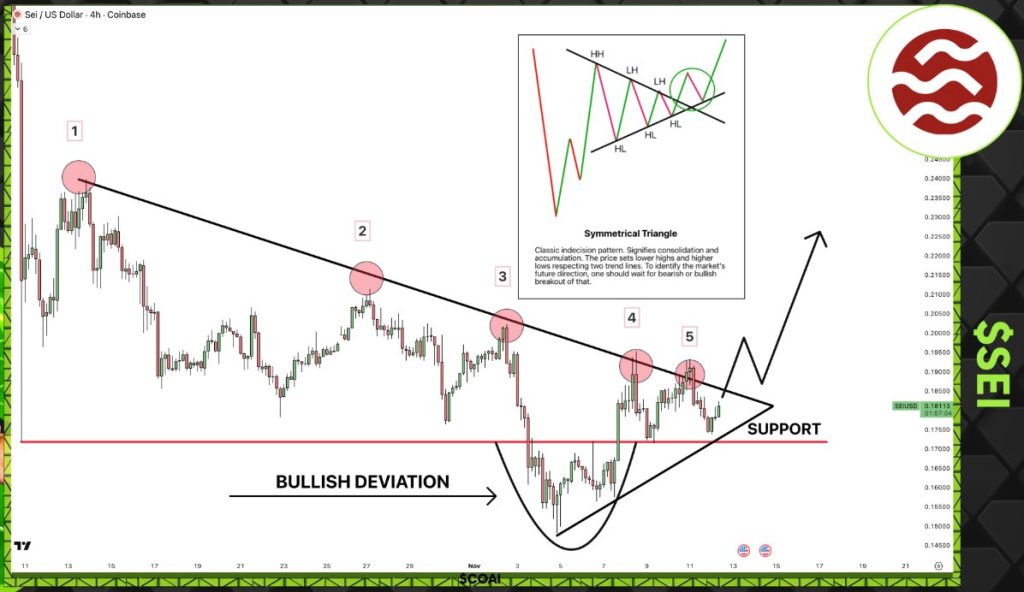
- If SEI loses the $0.175 support again, the bullish case weakens, potentially pushing price back toward $0.16. For now, the pattern shows stability and tightening action—conditions that typically precede significant moves.
- A symmetrical triangle has formed as the range between highs and lows narrows. This consolidation pattern usually precedes a directional breakout.
- A clean move above the descending resistance could open a path toward $0.21–$0.23, matching resistance levels from late October. If the breakout fails, expect extended sideways trading before another support retest.
- SEI’s price structure reflects a sentiment shift across Layer-1 tokens as investors hunt for technically strong setups following recent consolidation. The symmetrical pattern shows reduced volatility, suggesting traders are positioning for a breakout event. If confirmed, SEI could establish a medium-term uptrend after weeks of compression.
- SEI’s technical outlook remains constructive. The bullish deviation, multiple trendline retests, and sustained accumulation above support all point to building momentum. As price tightens within the symmetrical triangle, traders are watching for a decisive breakout that could launch SEI’s next bullish phase.
Source: SeiIntern (Unofficial)