XRP Struggles to Hold Critical Support as Bearish Momentum Builds Toward $1.50
The cryptocurrency market’s recent volatility has taken a particular toll on XRP, with technical indicators suggesting the token may be headed for a significant retracement. As of November 17, 2025, XRP is trading around $2.27, representing a sharp decline from its recent highs and raising serious questions about whether the much-anticipated late-2025 rally is in jeopardy.
Critical Breakdown Signals Potential Deeper Correction
Technical analysis of XRP’s price action reveals a concerning development that has captured the attention of traders across the crypto community. The chart pattern shows XRP losing a crucial breakout level that had previously served as support, a technical failure that often precedes more substantial declines in cryptocurrency markets.
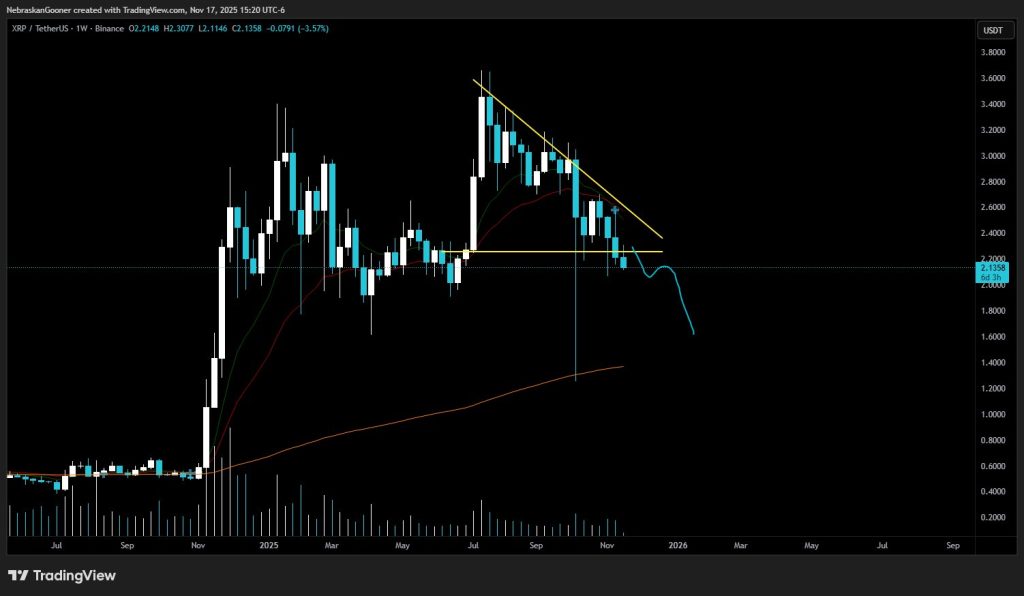
XRP has fallen over 40% from its 2025 high of $3.66 to around $2.20–$2.30, with the token now trading between the 38.2% and 50% Fibonacci retracement levels of the big 2025 rally. This retracement puts the cryptocurrency in a precarious technical position, with momentum indicators painting an increasingly bearish picture.
A classic “death cross” has formed on XRP’s daily chart, where the 50-day EMA crosses below the 200-day EMA, a pattern that traditionally signals bearish momentum. While death crosses don’t guarantee further declines, they typically indicate that sellers have gained control of the near-term trend and that additional downside is likely before any meaningful reversal occurs.
The Path to $1.50: Key Support Levels to Watch
The projection that XRP could decline to the $1.50 area isn’t purely speculative—it’s grounded in technical analysis of historical support zones and Fibonacci retracement levels. Understanding the roadmap between current prices and this potential target is essential for traders looking to manage risk effectively.
A decisive break below the psychological $2.00 level could open the door toward $1.76, while bulls need a move back above approximately $2.50 and the key moving averages to restore a more constructive structure. The $2.00 mark represents a crucial line in the sand—not just as a psychological level, but as a technical threshold that has served as both support and resistance throughout XRP’s recent trading history.
Between current levels and the $1.50 target lie several intermediate support zones that could temporarily halt the decline. Support exists at approximately $2.10–$2.08 and the broader $2.00 psychological zone, with a clean break below potentially inviting a test of $1.76–$1.87 according to several technical analyses.
The $1.50 level itself holds significance as a major Fibonacci support area and represents approximately a 50% decline from XRP’s 2025 peak. Historically, cryptocurrency corrections of this magnitude aren’t uncommon during broader market downturns or periods of technical consolidation following major rallies.