
Dogecoin Breaks Above Descending Trendline at $0.138–$0.140 on 4-Hour Chart
- In a recent technical update, Dogecoin is moving above a descending trendline on the 4-hour chart, signaling a potential shift in short-term price structure. The Heikin Ashi chart shows Dogecoin transitioning from a sequence of lower highs into a phase where buying pressure is beginning to re-emerge.
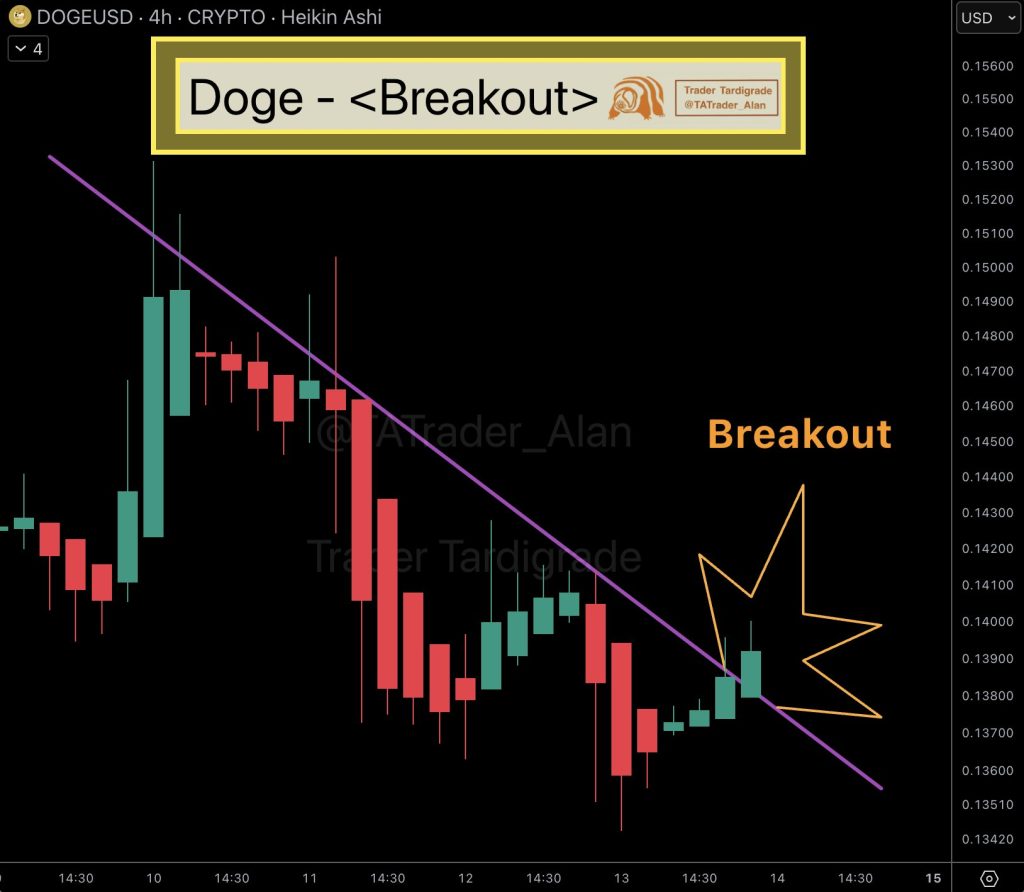
- The visual setup indicates that Dogecoin had been trading under a clearly defined downward trendline, which acted as resistance during the recent pullback. Price action has now pushed above that sloping resistance, with consecutive green Heikin Ashi candles forming near the $0.138–$0.140 area. This aligns with the observation that selling momentum has slowed, allowing buyers to regain partial control in the near term.
- The former descending trendline now serves as a key reference level. The projection suggests a period of consolidation above this level, followed by a possible continuation higher if price remains supported. No explicit price targets are specified, and the setup emphasizes structure rather than prediction, focusing on whether Dogecoin can sustain trading above the former resistance zone.
Dogecoin is transitioning from a sequence of lower highs into a phase where buying pressure is beginning to re-emerge, with consecutive green Heikin Ashi candles forming near the $0.138–$0.140 area.
- This development matters for market participants because trendline shifts on intraday timeframes often precede broader changes in short-term sentiment. Dogecoin is known for reacting quickly to technical momentum, and a sustained hold above the descending trendline could encourage additional trading activity. At the same time, a failure to maintain this level would indicate that the move was temporary, returning price action to the prior downward structure.
My Take: The break above the descending trendline at $0.138–$0.140 is a constructive short-term signal, but confirmation will come from sustained buying pressure above this level. Traders should watch for consolidation patterns or rejection wicks to gauge whether this shift in structure has staying power or fades quickly.
Source: Trader Tardigrade