XRP Price Pattern Shows 2017 Cycle Similarities with $3.80 Resistance Level
- XRP’s current market structure is being compared to its 2017 setup, based on long-term chart similarities highlighted by a crypto analyst.
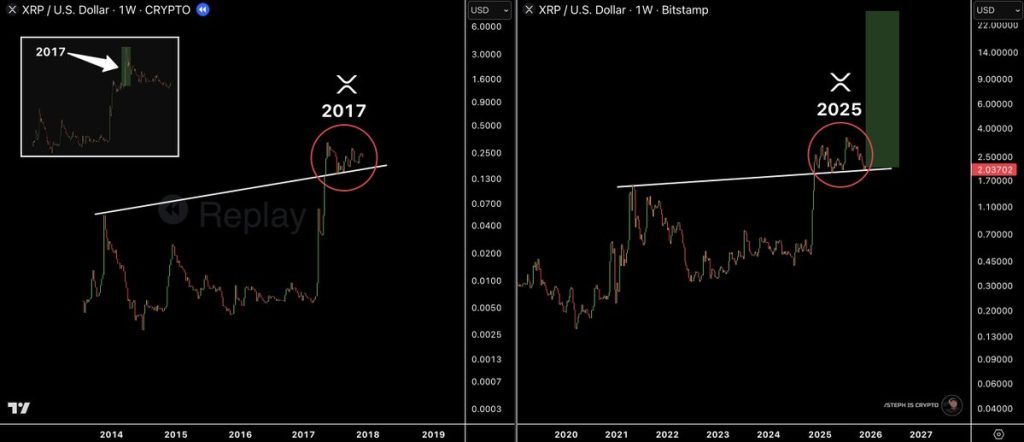
- In a recent market observation, a crypto analyst pointed to a notable resemblance between XRP’s current price structure and the one that preceded its major rally in 2017. The comparison is based on a weekly XRP/USD chart that places the 2017 and 2025 price cycles side by side, emphasizing how both periods feature extended consolidation phases following a broader accumulation trend.
- The image highlights a rising support trendline in both cycles, with price action compressing into a tight range near recent highs. In the 2017 example, this consolidation phase eventually resolved into a sharp upward move. The current 2025 chart shows XRP forming a similar structure, with price holding above a long-term support line and consolidating within a clearly defined range, as marked by the circled area on the chart.
“XRP is about to explode, just like it did in 2017. Buckle up!” the analyst noted, emphasizing the structural similarity between current and historical patterns.
- According to the analysis, the comparison is rooted in structural similarity rather than short-term price targets. This reflects the view that the present setup resembles a historical pre-expansion phase, without specifying timing or magnitude. The visual alignment between the two periods is the central focus of the analysis.
- From a broader market standpoint, long-term analog comparisons often draw attention during periods of consolidation, especially when assets revisit historical patterns. While the chart does not guarantee a repeat of past outcomes, the resemblance between the 2017 and current formations explains why XRP is attracting renewed interest. The market now appears to be at a stage where directional clarity may emerge as price continues to interact with long-term structural levels.
My Take: Historical pattern analysis offers valuable context but shouldn’t be treated as a guarantee. The 2017-2025 comparison highlights structural similarities worth monitoring, though market conditions differ significantly between cycles.
Source: STEPH IS CRYPTO