Gold Chart Shows Correction Phase Before Potential Rally to $4500-$5000
- Gold’s price movement keeps attracting traders as fresh technical insights point to an unfinished correction before the next rally phase. After topping in October with clear reversal signals, the metal now appears to be forming primary wave 4—a natural pause in the broader uptrend.
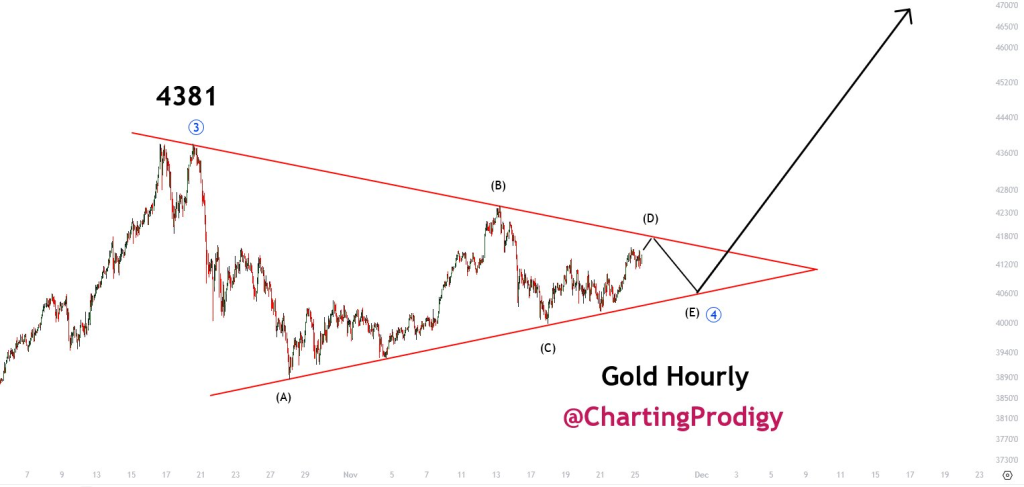
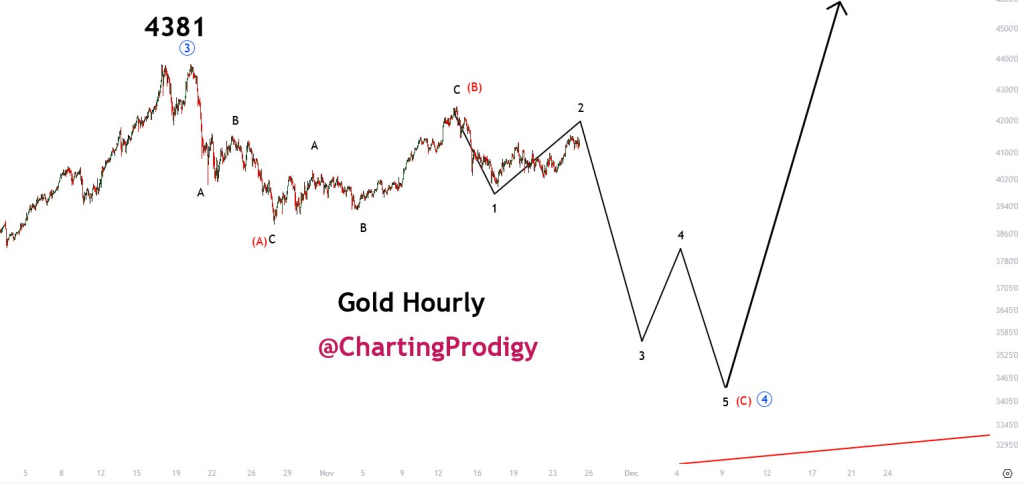
- Two corrective scenarios are currently in play. The first involves a triangle pattern, where price bounces between tightening support and resistance levels. Waves A through D are already complete, with wave E potentially forming before the next advance begins. “Once this structure resolves, we’re looking at wave 5 targeting the $4500 to $5000 zone,” according to the technical framework. The second scenario describes a flat ABC correction, with waves A and B done and wave C now unfolding as a five-leg decline.
- Both paths suggest gold is experiencing a healthy pullback within a longer bullish cycle. The analysis notes that commodity tops typically form after equity markets peak, similar to 2007-2008 dynamics. During early recession signals, gold historically strengthens as investors seek safety assets.
- Current consolidation appears temporary rather than a trend reversal. Technical models project new highs near $4500-$5000, with timing estimates pointing to the first half of 2026. The key now is watching how this correction completes in coming weeks.
My Take: This pullback looks like a setup, not a breakdown. If gold follows historical patterns during market uncertainty, the $4500-$5000 target becomes realistic. Traders should watch for correction completion signals before positioning for the next leg up.