NVDA Hits Long-Term Gann Arc Resistance — Traders Turn Cautious
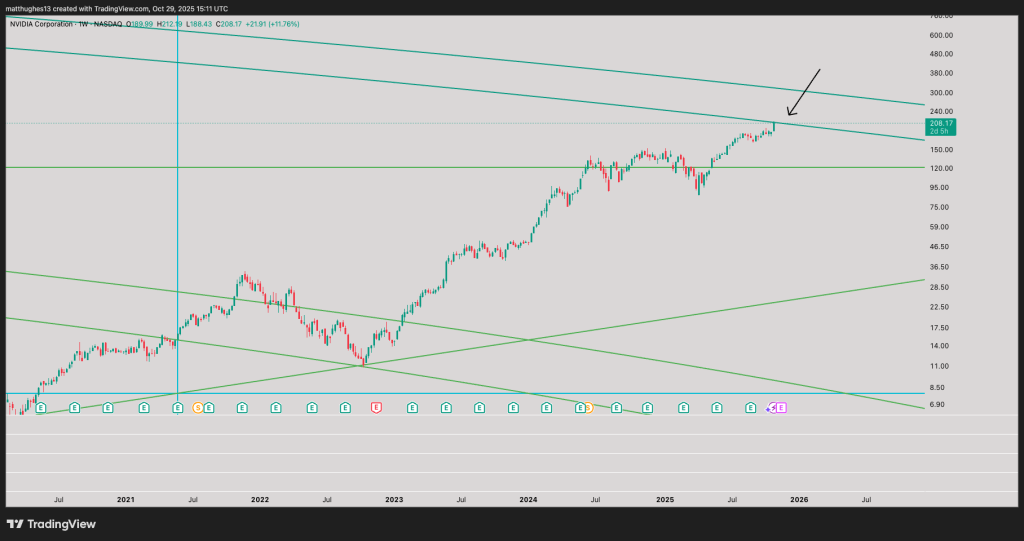
After a historic run that made NVIDIA the poster child of the AI boom, the stock is now bumping into a serious technical ceiling. NVDA’s weekly chart shows it touching a long-term Gann arc resistance line around $210–$220—a level that’s marked major turning points before. With semiconductors riding high and crypto sitting near strong support, traders are debating whether it’s time to cash out of AI stocks or shift into beaten-down digital assets.
What the Chart Shows
The weekly chart tells a clear story: NVIDIA’s been on an absolute tear since bottoming around $110 in late 2022, but now it’s running into a key Gann resistance arc—a geometric level that often signals cyclical shifts.
Here’s what traders are watching:
- Resistance Zone ($210–$220): NVDA is sitting right beneath the upper Gann band, which has acted as a ceiling in previous cycles, including the 2021–2022 peak before the correction
- Overextension Alert: The stock surged over 11% in one week—a sign of extreme bullish momentum that might be due for a breather
- Support Levels: If NVDA pulls back, key support sits at $150 (mid-channel) and $120 (lower Gann line)—healthy reset zones, not necessarily bearish signals
- Long-Term Structure: The primary uptrend stays intact as long as NVDA holds above $150, though short-term traders may want to wait for a better entry
The Bigger Picture: Semis vs. Crypto
The Great Mattsby posed an interesting question: “Why would I be chasing semis up here when crypto is near support?”
This hints at a potential capital rotation brewing across markets. Semiconductors like NVIDIA, AMD, and TSMC have run hot on AI hype, while crypto has been consolidating for months at relatively low levels. These kinds of divergences often come before sector shifts—where overheated equities cool off while alternative assets like Bitcoin and Ethereum start their next leg up.
Why Gann Resistance Matters
Gann arcs, developed by legendary trader W.D. Gann, use geometric angles and time cycles to spot potential market turning points. When price hits a Gann resistance line while momentum is peaking, it often signals a pause or pullback—not necessarily a reversal, but a moment where smart traders tighten stops or take profits.
For NVIDIA, this intersection suggests the rally might need to catch its breath after an incredible run.
What This Means for Markets
AI Euphoria Check: NVIDIA’s valuation has topped $5 trillion, making it the most valuable company ever. The technical resistance shows just how stretched sentiment has become.
Rotation Risk: As investors lock in semiconductor gains, money could flow into lagging sectors—crypto, small caps, commodities.
Institutional Moves: Portfolio managers might use this zone to rebalance, especially with stabilizing bond yields and shifting policy expectations.