XRP Price News: Coinbase Levels Indicate a Possible Final Dip Before Rebound
The chart relies on Elliott Wave theory and Fibonacci retracement levels, suggesting XRP might have one final drop left before starting a broader bullish recovery. With key zones forming around $2.65 and $1.64, this breakdown gives investors a clearer technical map through the current market chop.
Elliott Wave Structure Points to Final Leg Down
As traders watch for XRP’s next big move, new technical analysis from CasiTrades is drawing attention to crucial price levels on Coinbase that could shape the token’s immediate future. The chart shows an extended corrective pattern labeled (A)-(B)-(C), with internal waves numbered (1) through (5). Based on the wave count, XRP looks to be wrapping up Wave (4) after failing to hold above the $2.65–$2.70 area—a zone that lines up with a 0.618 Fibonacci retracement and has acted as resistance.
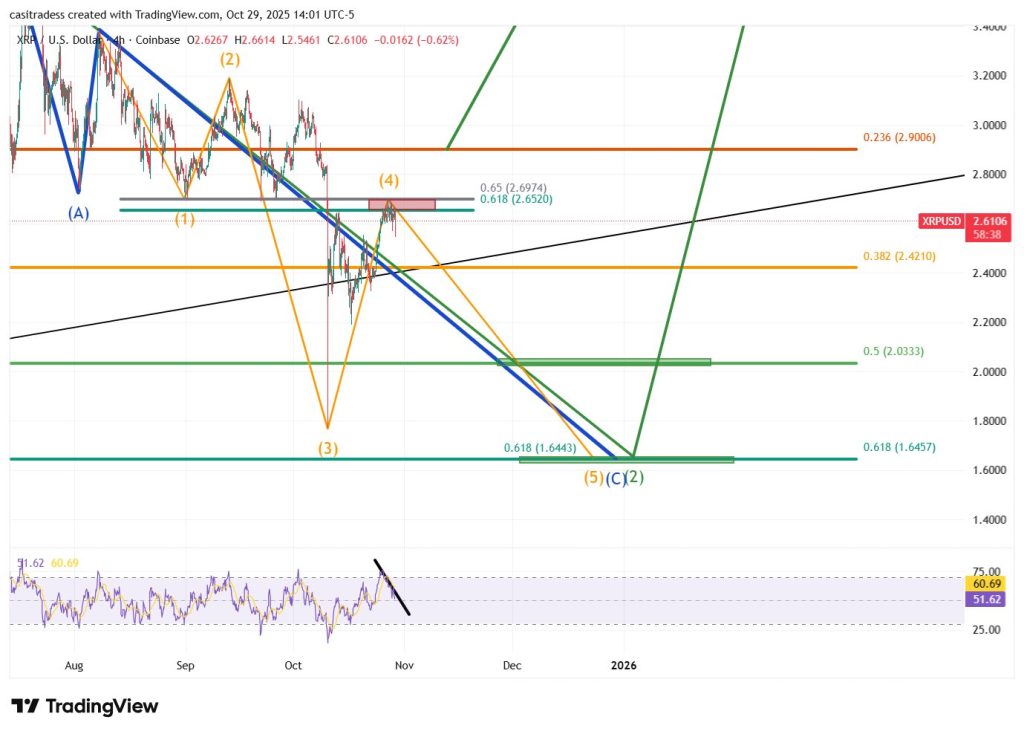
The next move targets the $1.64–$1.65 range, marked by a 0.618 Fibonacci extension, where Wave (5) is expected to bottom out. This kind of setup often signals the end of a correction before a longer-term reversal kicks in—potentially setting XRP up for a bullish run into 2026.
Key Levels Traders Are Watching
- Immediate Resistance: $2.65–$2.70 (aligns with Wave 4 peak and 0.618 retracement)
- Intermediate Support: $2.42 (matches the 0.382 retracement)
- Major Support Zone: $1.64–$1.65 (Wave 5 target and 0.618 extension)
If XRP drops below $2.40, momentum could push it quickly toward the $2.00–$1.65 support band at the lower edge of the descending channel. On the flip side, holding around $2.60 might delay the decline, though a sustained breakout seems unlikely without fresh buying volume.
The chart’s RSI (Relative Strength Index) shows clear bearish divergence—price printed a higher high while RSI trended lower. This pattern usually comes before short-term pullbacks and suggests bullish momentum is fading as XRP approaches the resistance ceiling. It adds weight to the idea that Wave (4) may already be done, with a controlled drop toward Fibonacci support coming next before any reversal takes hold.
What It Means for Traders
This technical setup unfolds against mixed sentiment across crypto markets. While Bitcoin and Ethereum have recently found some stability, altcoins like XRP remain sensitive to liquidity shifts and macro news. Ripple’s ongoing partnerships offer long-term promise, but short-term price action stays technical and range-bound. Coinbase traders are keeping close tabs on these Fibonacci levels to time potential entries and exits as XRP works through what could be its final dip before turning higher.