
Bitcoin Chart Signals Next Major Reversal
- Trader Merlijn The Trader recently shared what he calls “the line in the sand for Bitcoin,” highlighting a pattern where every FOMC-related dip this cycle has led to a strong recovery. His chart shows Bitcoin’s price movements with red and green zones marking FOMC periods, revealing a clear rhythm of brief pullbacks followed by sharp rallies.
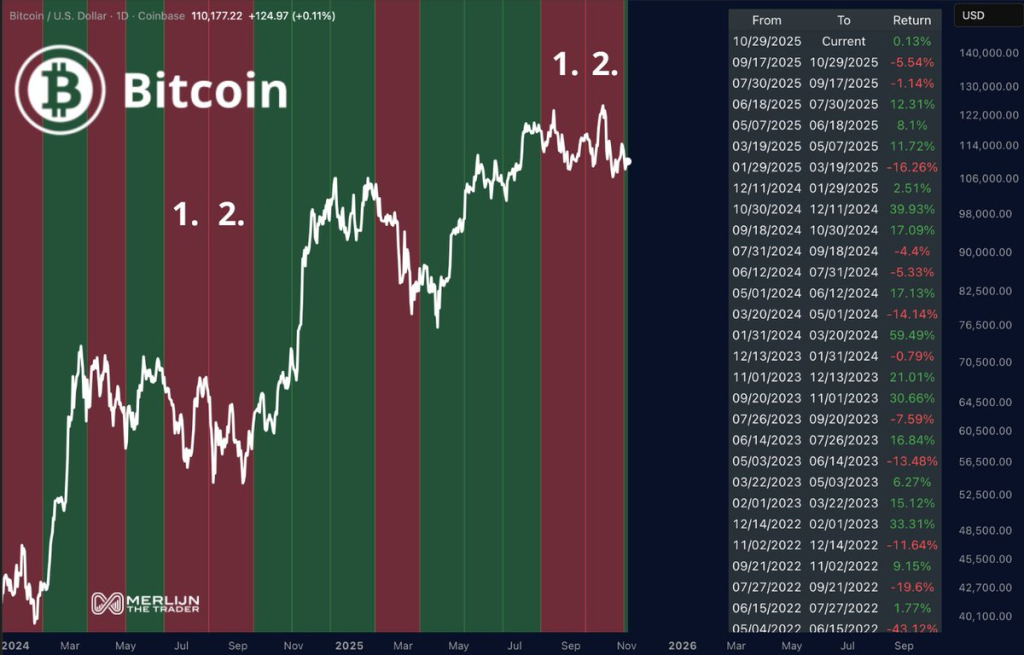
- Bitcoin’s reaction to Federal Reserve policy has been predictable this cycle. FOMC meetings typically trigger volatility that shakes out over-leveraged traders before the price bounces back. Every red zone so far — marking periods of weakness — has been followed by a major move up. “Every FOMC dip this cycle bounced hard,” Merlijn The Trader noted, adding that even after two red phases, Bitcoin “ripped higher.” The chart now shows a third red zone in a row, something that “has never happened” before, which suggests a reversal could be coming.
- The numbers back this up. Previous FOMC dips saw Bitcoin rebound between +17% and +59%, while corrections averaged just –5% to –14%. Trading near $110,000 now, Bitcoin has held up well despite macro uncertainty. The analyst believes this pattern could signal the start of another bullish leg, similar to what happened in 2023, 2024, and early 2025.
- The analysis also shows how Bitcoin has evolved into a macro-sensitive asset that responds more predictably to central bank decisions than it used to. With rate-cut expectations building, many traders see this consolidation as a potential launch point for the next rally. “History screams reversal,” Merlijn The Trader wrote, suggesting the market may be ready for renewed buying.
- While no pattern guarantees future results, the technical and historical setup has fueled optimism in crypto markets. For many, this FOMC zone could mark the beginning of Bitcoin’s next major leg up.