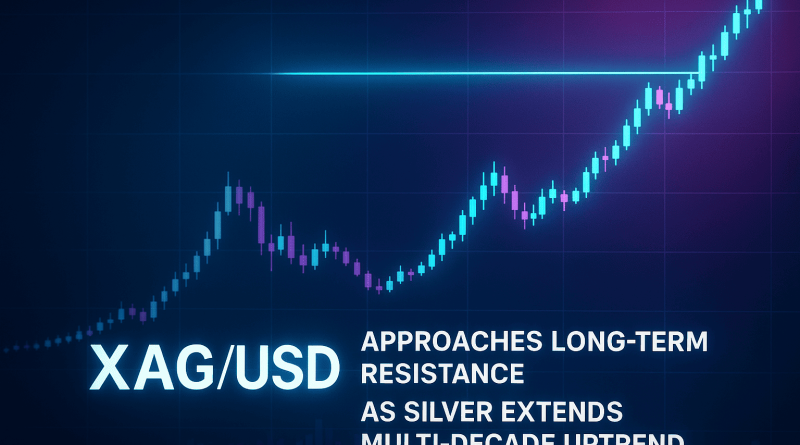
XAG/USD Approaches Long-Term Resistance as Silver Extends Multi-Decade Uptrend
Silver is trading close to $50, reaching a major long-term resistance zone visible on the 55-year chart. The multi-decade structure shows repeating numerical sequences and algorithmic levels that have influenced price cycles for over half a century. This move brings silver back to a historically significant area that marked key turning points in previous cycles.
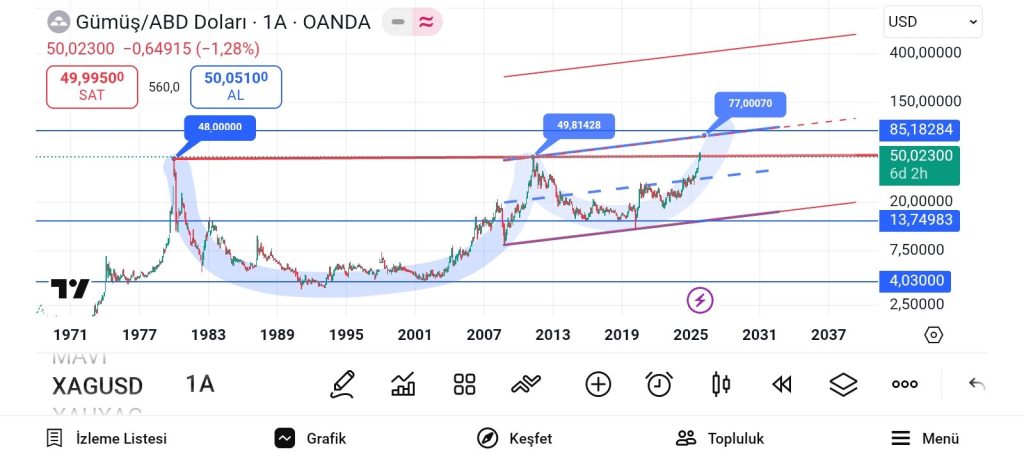
The chart highlights earlier peaks around $48 in the late 1970s and near $49.8 in 2011, both closely aligned with today’s price action. The formation suggests a broad cyclical rhythm with extended accumulation periods followed by steep upward expansions. Algorithmic values like 5, 15, 45, and 135 correspond to proportional moves observed repeatedly throughout the chart. Price remains inside a rising channel, with upper projections pointing to potential zones above $70.
Current structure places silver at the upper boundary of this historical range while maintaining long-term trend support. Projected levels include potential targets near $77 and above $85, where long-term trendlines converge. Lower structural supports remain around $20 and $13.74, representing foundational areas established across earlier decades.
This long-term view matters because repeating historical levels and multi-decade patterns often influence broader commodity sentiment. With silver once again testing the $50 region, attention focuses on whether this area will act as a ceiling or open the path toward the next stage of its long-term cycle.
source: mühendisborsa