Silver Analog Shows Historic Path Toward $85 and Beyond
- Silver is drawing fresh interest after analysts unveiled a historical breakout comparison linking today’s price action to some of the metal’s most dramatic rallies. The chart lines up silver’s 2025 breakout with major moves from 1967, 1973, and 1978, revealing how past cycles unfolded after breaking through long-term resistance. It even highlights that the 1980 rally, plotted on a linear scale, soared near $420.
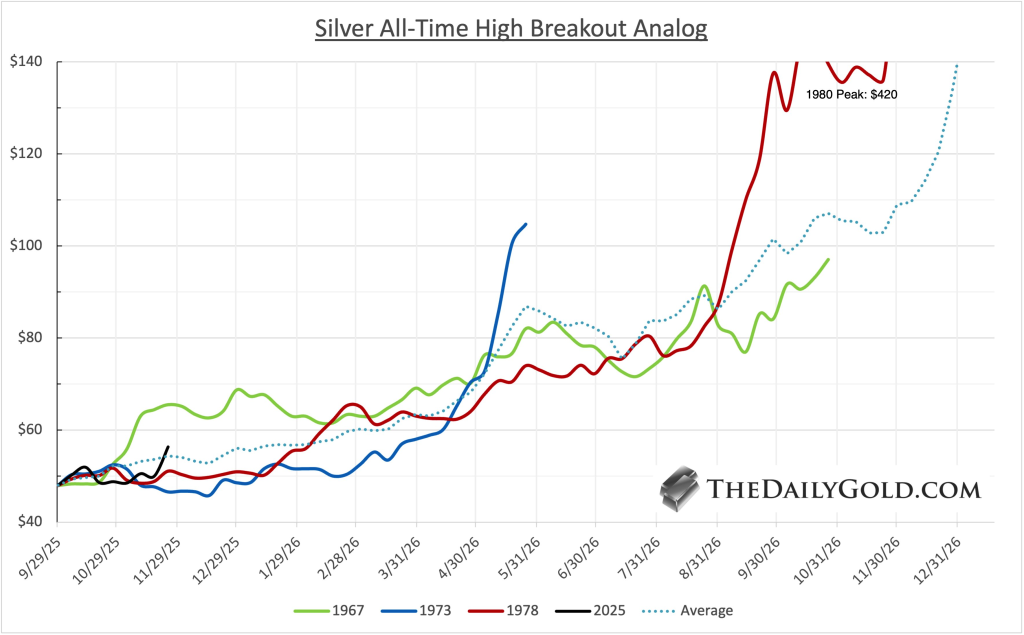
- Right now, silver’s breakout is tracking the early stages of those historic runs. Previous cycles typically consolidated around $50 to $60 before accelerating sharply higher. The dotted average line across these analogs suggests breakouts have historically reached around $85 within six months, capturing the momentum that followed initial signals during those earlier periods.
- Traders are noting how closely the current setup resembles the 1978 trajectory, which kicked off one of silver’s most powerful advances. Those past cycles generally showed brief pullbacks before entering extended parabolic phases, fueled by macroeconomic pressure and tightening supply. Silver’s 2025 breakout sits in the early phase of this analog, steadily climbing above key resistance zones.
- The analog offers a roadmap for understanding where silver might head during breakout conditions. By comparing today’s move to historic inflationary and monetary transitions, the framework shows how silver responded during previous structural shifts. Market watchers are keeping close tabs on whether this advance continues following the strong breakout paths seen in past decades.
My Take: This analog is a reminder that silver doesn’t move in straight lines but follows recognizable cycles. If the pattern holds, we could see acceleration similar to past decades. However, past performance never guarantees future results, so risk management remains essential.
Source: Jordan Roy-Byrne CMT, MFTA