
ETH Shows Repeating Cycle Structure Ahead of 2025 Setup
Ethereum is showing a multi-cycle price pattern that looks a lot like earlier market phases. Chart analysis reveals that ETH has entered an accumulation zone similar to those seen in 2017 and 2020—both of which came before significant upward moves. The comparison between these three cycles shows the 2025 structure fitting into the same technical pattern that sparked major rallies in the past.
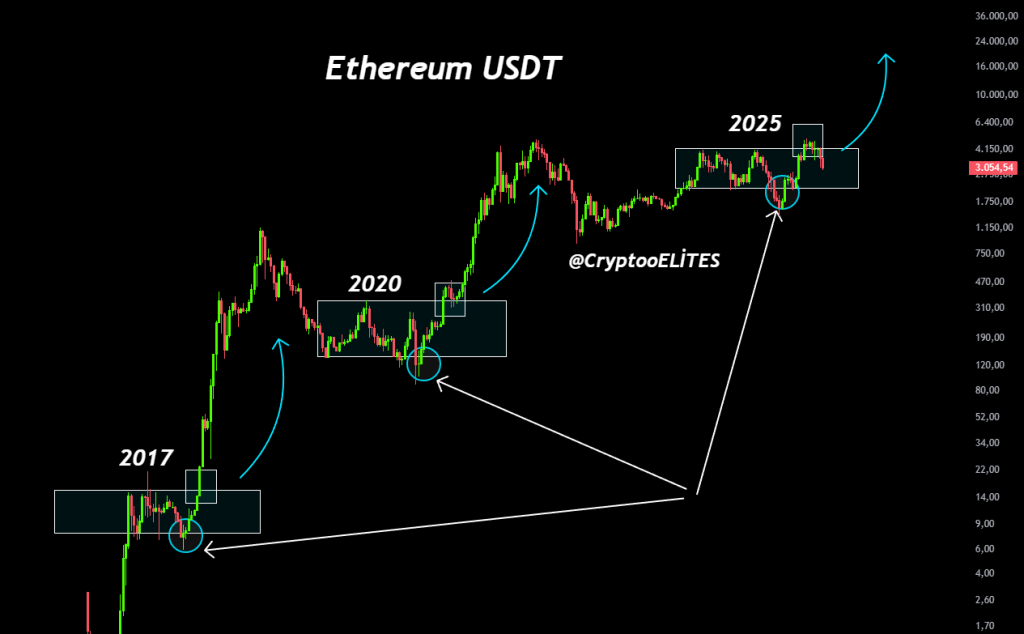
Looking at the data, each previous cycle started with an extended accumulation period, followed by a final shakeout before Ethereum reversed sharply upward. Back in 2017, ETH spent months consolidating before launching into a major rally. The same thing happened in 2020, with a final dip within the range before the price flipped and broke out strongly.
Right now in 2025, Ethereum sits in a similar technical zone, with price action behaving much like it did during those earlier cycle bottoms. The chart indicates that ETH is testing the lower edge of its accumulation range again, mirroring the shakeout-and-breakout pattern from previous years. The recurring combination of range accumulation, a liquidity sweep, and an upward macro move is visible across all three cycles: 2017 → 2020 → 2025.
This pattern matters because repeating long-term structures often influence market sentiment and expectations around major asset cycles. While past behavior doesn’t guarantee future results, the presence of a familiar setup keeps the conversation going about whether Ethereum might be gearing up for another expansion phase. Watching how ETH behaves inside this zone could provide more insight into where the next major cycle move might go. Source: Walter Bloomberg