Nvidia Tests $170 Support With $230 Upside Target
Nvidia is once again attracting strong attention from technical traders as the stock approaches a critical support zone following its recent correction. After a powerful rally earlier in the market cycle, price action is now entering a phase where Fibonacci retracement levels and wave structure analysis could determine the next directional move.
Investors are closely monitoring whether the current pullback represents a normal consolidation within a broader bullish trend or the early stages of a deeper corrective phase. The answer may largely depend on how price reacts around the $170 technical support region.
Key Technical Structure
Nvidia shares are drawing renewed technical interest after chart analysis identified a potential accumulation area near the $170 level. Traders are watching for signs of stabilization after the recent corrective move within what still appears to be a broader bullish structure.
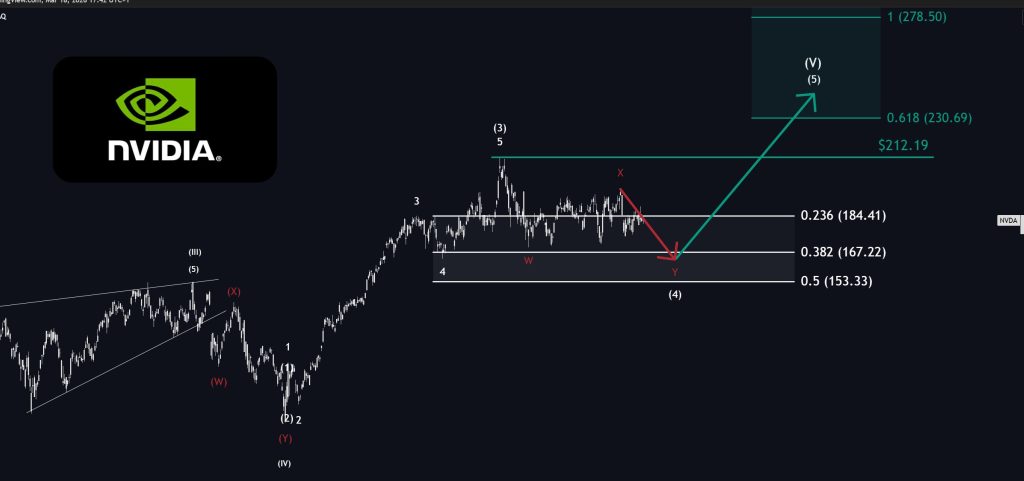
Current technical analysis shows NVDA consolidating after a strong upward move, with Fibonacci retracement levels identifying possible support zones around $184.41, $167.22, and $153.33. This structure aligns with a possible Wave 4 correction scenario, where price could test the $167 region before attempting a recovery.
If a rebound develops, the first upside target could emerge near $212. Continued bullish momentum could then open the path toward the $230 region, which aligns with the 0.618 Fibonacci retracement level.
Broader Market Context
The discussion around Nvidia also reflects its position within the broader technology sector, especially its exposure to artificial intelligence infrastructure and advanced computing demand. Similar themes appear in discussions such as AI infrastructure spending trends, TSMC semiconductor supply chain positioning, and NIO institutional accumulation trend, all of which demonstrate how capital flows continue to influence sentiment toward major growth companies.
These structural themes continue to support the long term growth narrative for Nvidia, particularly as demand for AI hardware and data center expansion remains one of the dominant drivers across the semiconductor industry.
Key Levels To Watch
The current NVDA technical structure shows how retracement levels remain critical reference zones after strong rallies. Price behavior around these support areas may determine whether Nvidia resumes its bullish trend or continues its consolidation phase.
If buyers successfully defend the $170 region, this could confirm the level as a strong technical base. A failure to hold this support may expose lower retracement zones and extend the ongoing correction.
My Take: The $170 support zone represents an important technical test for Nvidia’s broader uptrend. If this level holds and accumulation develops, the technical structure could favor bullish continuation toward the $230 region. However, if support fails, the correction could extend further before a new trend forms.
Source: Twitter Post by The Analyst