
NVDA Price Analysis: Nvidia Tests $185 Resistance as $165-170 Support Zone Holds
Nvidia shares are testing a short-term descending resistance line on the daily chart. NVDA is trying to stabilize after pulling back from recent highs, still trading above a solid support range. The stock’s hovering in the low 180s after bouncing from the $165–170 area, which has held up as support for about six months now.
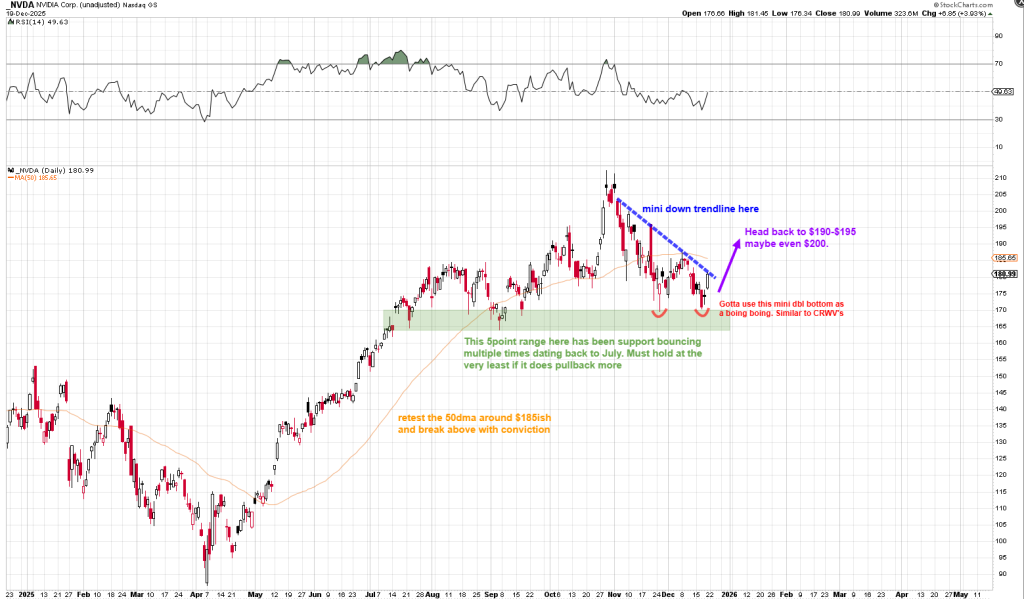
This $165–170 zone has been tested several times since mid-year and keeps attracting buyers. Recent selling pressure faded as price approached this range, showing that downside momentum is losing steam. The focus now shifts to the 50-day moving average sitting around $185. That’s the first real technical barrier, especially since it lines up with earlier consolidation and near-term resistance.
“Nvidia is attempting to stabilize after a pullback from recent highs while continuing to trade above a well-defined support range.”
If NVDA breaks above the descending resistance and clears the 50-day MA cleanly, it could open the door to higher levels. The chart points to $190 as the next upside target, with a possible push toward $195–200 if momentum picks up. But these scenarios depend on the broader market holding steady and NVDA staying above that $165–170 support zone. Right now, there’s no confirmed breakout—just a setup that’s developing.
This technical picture matters because Nvidia remains a major force in semiconductors and the wider market. Holding key support while compressing under resistance suggests something’s about to give. Whether NVDA confirms a breakout or stays range-bound will likely set the tone for short-term sentiment in large-cap growth stocks as we head into year-end.
My Take: The setup looks textbook—solid support, descending resistance, and price coiling. If NVDA reclaims $185, we could see a quick move to $190-195. But without broader market support, it might just chop sideways into year-end.
Source: Heisenberg