
NVDA Stock Forms Falling Wedge as Nvidia Enters Santa Rally Watchlist
Nvidia (NVDA) just popped up on technical scanners after carving out what looks like a textbook falling wedge on the daily chart. It’s standing out as one of the cleaner setups right now as we roll into the Santa Rally period. What we’re seeing is price getting squeezed between two downward-sloping lines that keep getting tighter and tighter.
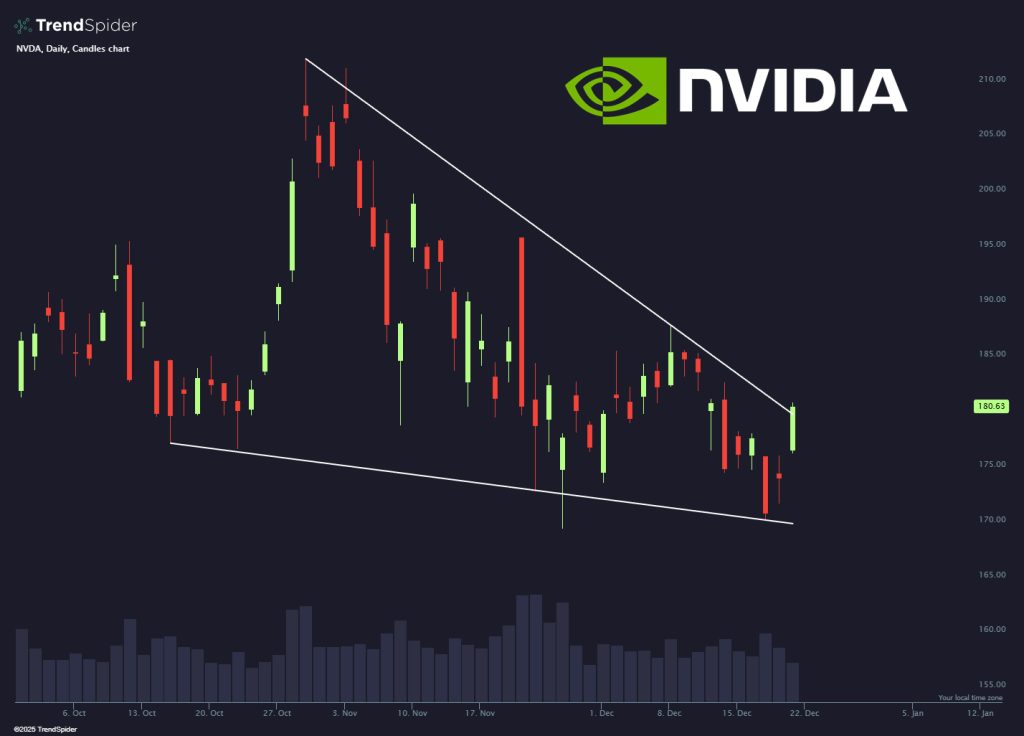
The pattern’s pretty straightforward—Nvidia’s been sliding from around the low $200s down toward the $170–$180 zone, staying trapped between those two trendlines the whole way. The stock’s currently sitting near $180.6, which puts it dangerously close to that lower edge. But here’s the interesting part: the selling isn’t aggressive anymore. It’s more like a slow squeeze than a panic dump.
“The stock was identified among the cleanest current setups while scanning for falling wedges heading into the Santa Rally window.”
Falling wedges usually show up when price is getting compressed and volatility’s drying up—and that’s exactly what’s happening with NVDA. The lower line’s been tested multiple times now, showing there’s some real support down there, while the upper boundary keeps rejecting any bounce attempts. No breakout yet though, so this whole thing’s still cooking.
My Take: This matters more than usual because Nvidia’s basically the poster child for AI and chips right now. Year-end trading can get weird with liquidity shifts, and these wedge patterns tend to get extra attention during Santa Rally season. However NVDA breaks—up or down—could set the tone for tech.
Source: TrendSpider