HIMS Stock Shows $100 Upside Potential With Limited Downside Risk
Hims & Hers Health Inc. is drawing increased attention from traders following the emergence of a highly favorable technical setup on the monthly timeframe. Current price action suggests downside risk is relatively limited, while upside potential remains significant if the broader uptrend resumes. This type of asymmetry has become increasingly attractive in volatile growth stocks.
Key Technical Signals
Monthly Price Structure and Trend
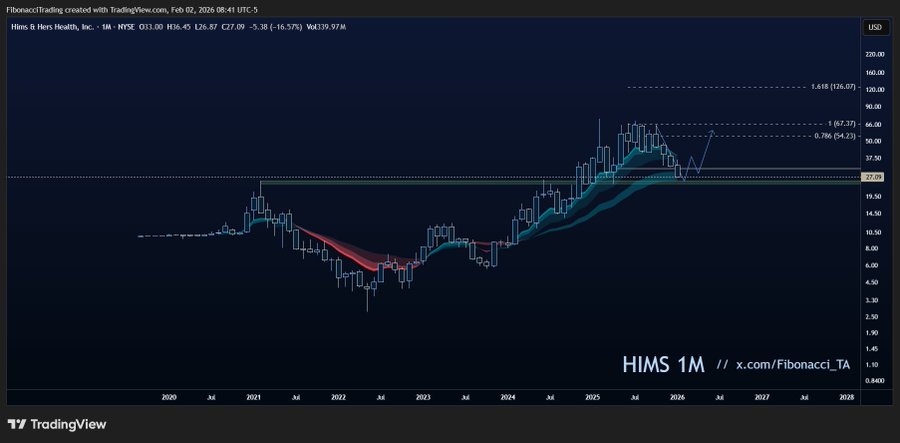
HIMS is trading around the $27 level after an extended rally that began from 2022 lows. The stock surged strongly through 2024 and early 2025, reaching highs near $70 before entering a corrective phase. Despite the pullback, the broader long-term trend remains intact, with price now consolidating above key historical support.
Fibonacci Support and Extension Levels
Fibonacci retracement analysis shows that current prices are holding near a major support zone on the monthly chart. This creates a relatively tight risk window if the level fails. At the same time, Fibonacci extension targets project potential resistance levels well above prior highs, with long-term upside projections reaching toward the $100 area.
As the analyst behind the chart noted, the setup is “binary—either a small loss if support fails, or a large gain if the trend continues.”
Why This Setup Matters
The current structure highlights a clear imbalance between downside risk and upside reward. If HIMS breaks below monthly support, losses would likely be limited relative to the size of the previous advance. However, if momentum reaccelerates, the open upside implied by Fibonacci projections offers a substantially larger payoff.
This type of clearly defined risk boundary is especially valuable in high-growth, high-volatility equities.
Broader Market Implications
Beyond HIMS itself, this setup illustrates how technical analysis is increasingly used to define probability-based scenarios rather than predict exact price direction. In growth stocks, extended consolidation phases often precede major moves, and asymmetric structures like this one allow traders to position with favorable mathematical odds even amid uncertainty.
Outlook
The outlook for HIMS depends almost entirely on whether price can continue to hold above monthly support. A breakdown would invalidate the bullish thesis quickly, while a renewed uptrend could open the path toward significantly higher levels over time. Until confirmation occurs, HIMS remains a high-risk, high-reward technical setup worth close monitoring.
My Take
HIMS presents a textbook asymmetric opportunity where the math favors bulls as long as support holds. The potential move from the high-$20s toward $100, versus comparatively limited downside, makes this setup compelling for traders watching for long-term breakout confirmation.
Source: FibonacciTrading