
ETH Eyes Breakout: Ascending Inverse H&S Pattern Points Toward $17,000 Target
Ethereum is catching fresh attention as traders spot a promising long-term bullish pattern taking shape on the 3-day chart. ETH is currently sitting at the tip of the right shoulder in what appears to be a major Ascending Inverse Head and Shoulders formation. If this pattern plays out as expected, it could signal a significant continuation move and mark a shift in long-term momentum.
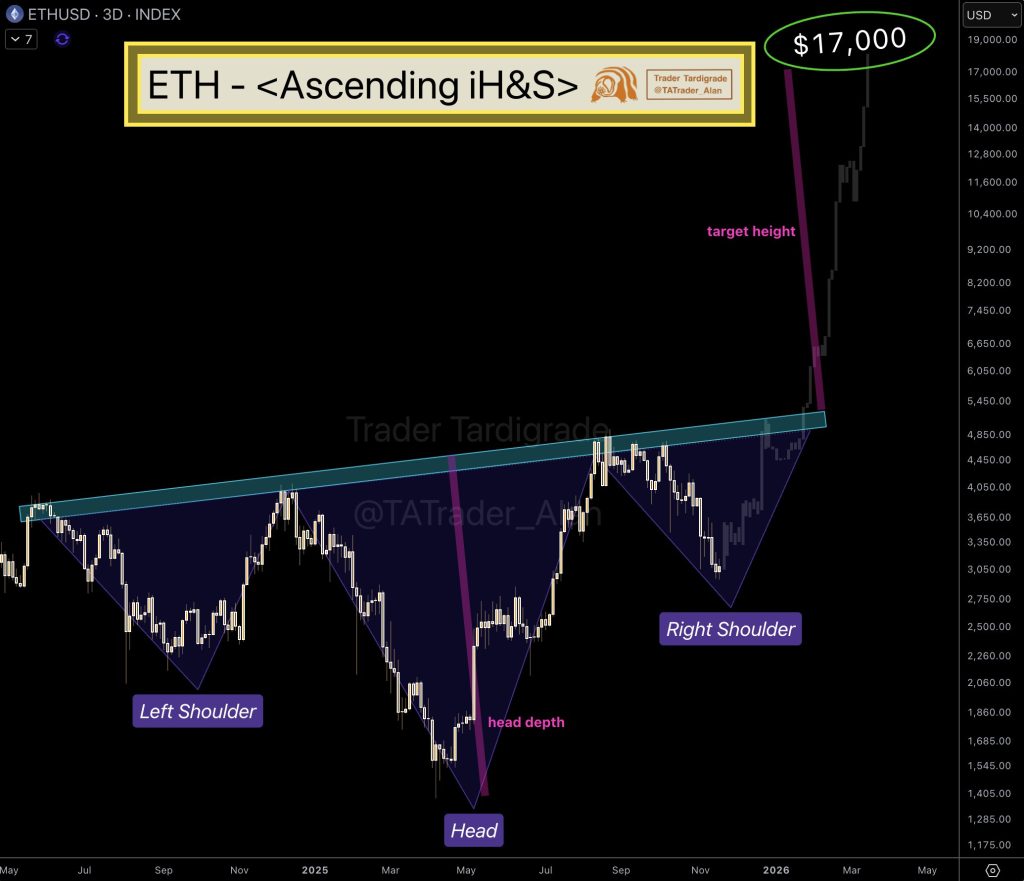
The chart clearly shows Ethereum building out a textbook left shoulder, head, and right shoulder, with the neckline gradually trending upward. Price has been respecting this structure over an extended timeframe, and recent candles show ETH approaching the neckline area once again. A clean breakout above this resistance zone would unlock a technical target near $17,000—a substantial projected rally based on the pattern’s measured move. Ethereum has been carving out higher lows, which reinforces the bullish case.
Market sentiment around ETH is looking healthier as price holds near a critical breakout level, backed by rising structure and steady trend formation. While the breakout hasn’t happened yet, the pattern’s symmetry and the depth of the head match up nicely with the bullish target shown on the chart. If momentum kicks in above the neckline, ETH could see serious upside over the coming months.
This Ascending Inverse Head and Shoulders setup matters because it points to a broader shift in Ethereum’s market structure. A confirmed breakout would signal growing demand, fresh momentum, and a possible move into a higher trading range. As one of the top assets in crypto, an Ethereum rally toward this projected target would likely lift broader market sentiment and fuel renewed bullish conditions across the digital asset space.