
Dogecoin Price Prediction: Liquidity Zones Point to Breakout
Dogecoin might be cooking up something big. Fresh liquidity data is painting a clear picture of where the real action could unfold, giving us a decent roadmap for DOGE’s next moves. The meme coin that refuses to die is sitting at some pretty interesting technical levels right now.
What the Liquidity Maps Are Showing
Charts from @Cryptoinsightuk are highlighting some fascinating daily and hourly liquidity zones that could make or break DOGE’s current rally. These aren’t just random lines on a chart – they’re showing us exactly where the big money is positioned and where the next battle might happen.
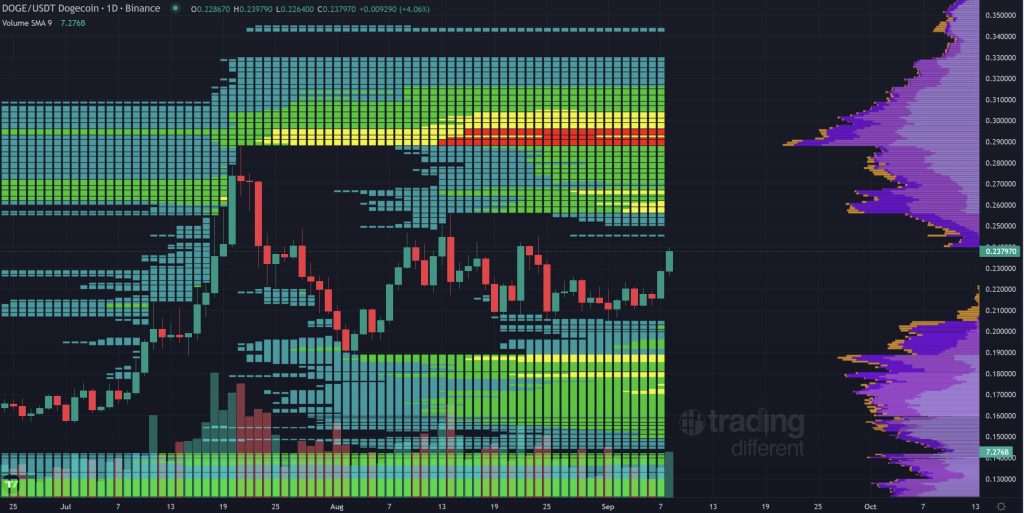
DOGE is currently hovering around $0.238, which puts it in a sweet spot between major liquidity zones. The bulls have built a solid foundation with heavy buy-side liquidity stacked between $0.18-$0.20 – that’s your safety net if things go south. But the real excitement is up north, where sell-side clusters are waiting around $0.26-$0.28. Those recent green candles aren’t just random noise either; they’re suggesting something bigger might be brewing.
Why This Actually Matters
Here’s the thing about liquidity mapping – it’s like having x-ray vision into where the market wants to go. For a coin like DOGE that moves on sentiment and momentum, these liquidity pockets become rocket fuel when they get tested. The meme coin crowd is still hungry, and when you combine that with clear technical levels, things can get wild fast.
If DOGE manages to stay planted above $0.23, we’re looking at a pretty clear runway toward that $0.26-$0.28 resistance cluster. But crypto being crypto, a stumble here could send it tumbling back into that $0.20 liquidity zone where the buyers are waiting. Either way, the setup suggests we’re about to see some real movement – the question is just which direction DOGE decides to break.