
Dogecoin Chart Reveals Key Technical Pattern at Critical Neckline Level
- A daily Dogecoin chart highlights a developing inverse head and shoulders formation. The pattern is drawing attention as price trades near a key neckline area.
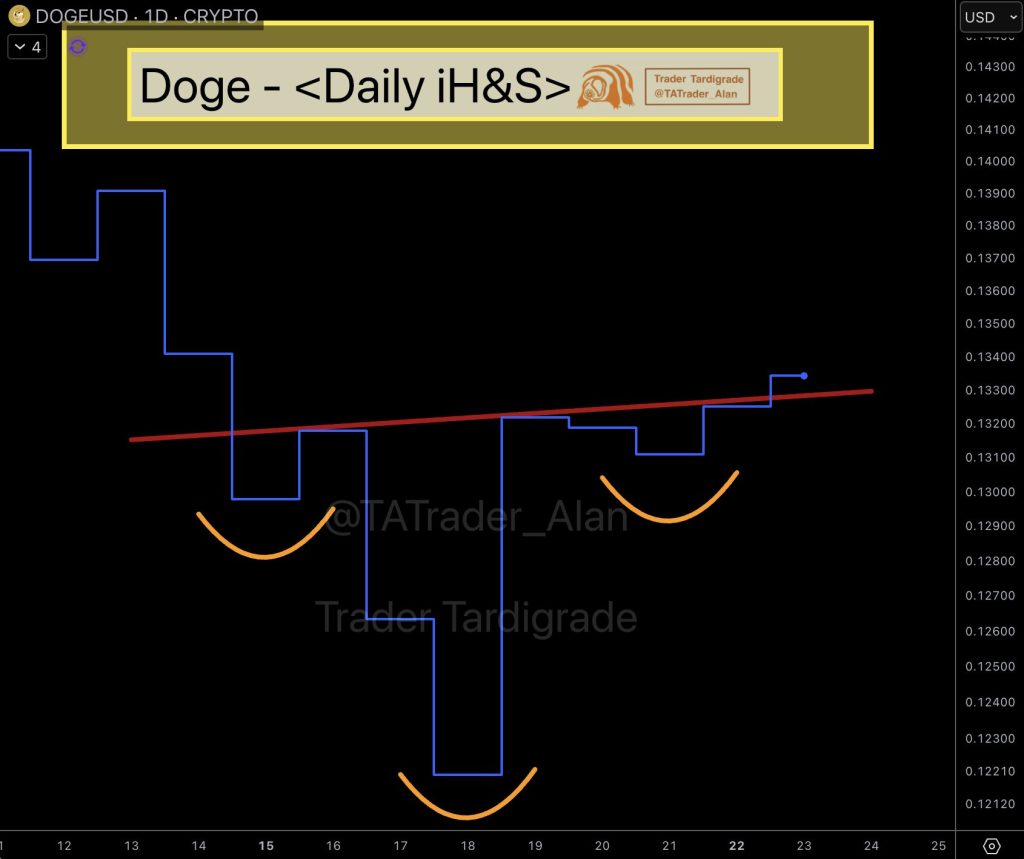
- A notable technical structure is forming on Dogecoin’s daily chart. The DOGE/USD chart is revealing an inverse head and shoulders pattern, a commonly referenced formation in technical analysis that traders watch for potential trend shifts. The chart visually outlines the structure, with the pattern clearly marked across recent price action.
- The chart shows three consecutive troughs, with the central low forming the deepest point, visually representing the “head,” while the two surrounding lows form the “shoulders.” An upward-sloping neckline is drawn across the highs separating these troughs, indicating a key resistance level that defines the structure. The image also highlights that Dogecoin’s price is currently positioned close to this neckline, placing the pattern at an important technical juncture.
The DOGE/USD chart is revealing an inverse head and shoulders pattern, a commonly referenced formation in technical analysis that traders watch for potential trend shifts.
- From a risk perspective, the image does not indicate that a breakout has already occurred. The pattern remains in development, and inverse head and shoulders formations require confirmation through sustained price movement beyond the neckline. Until that occurs, the structure should be viewed as a technical setup rather than a confirmed signal. The chart itself does not include volume data or additional indicators, and no specific price targets are referenced in the source material.
- In broader market context, Dogecoin continues to trade within a range that reflects ongoing uncertainty across the cryptocurrency market. Technical patterns like the one highlighted often attract short-term trading attention, particularly when clearly defined support and resistance levels are visible. The inverse head and shoulders formation places Dogecoin at a technically significant point, where future price direction will depend on how the market reacts around the neckline level rather than on the pattern alone.
My Take: This pattern looks textbook, but remember – no breakout means no confirmation. The neckline is where the action happens. Until DOGE clears that resistance with volume, this remains a setup worth watching but not trading yet.
Source: Trader Tardigrade