
Gold Price Projection: 25-35% Rally Could Push Prices to $5,300-$5,700 by April 2026
- Gold has continued to advance after resolving a symmetrical triangle in mid-December, with price action so far aligning with historical breakout behavior. A recent market note highlighted a key technical development following the pattern resolution on December 11. As shown on the chart, gold has advanced by approximately 6% over the first 12 days after the move, pushing prices toward the $4,480 area.
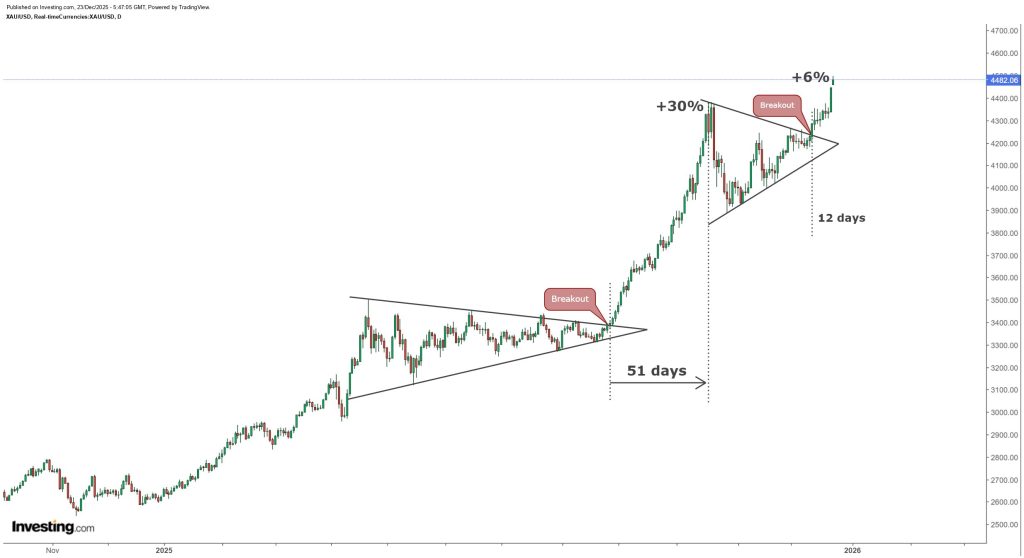
- The chart also compares this move with a previous symmetrical triangle resolution that occurred in the final days of August. That earlier pattern resulted in a strong continuation rally, delivering a 30% gain over a 51-day period, as annotated on the image. The comparison illustrates how gold has previously responded to similar consolidation phases before transitioning into accelerated upside momentum.
- Based on this historical precedent, a potential scenario emerges in which gold could extend its move by roughly 25% to 35% from the December resolution zone. Such a move would place price in a projected range of approximately $5,300 to $5,700, with the timeline extending into March or April 2026.
The breakout structure and timing are clearly marked on the image, providing a visual reference for the current advance while comparing it to the August pattern that delivered 30% gains over 51 days.
- At the same time, the outlook accounts for the possibility of a nearer-term pause. Gold could enter a consolidation or corrective phase between mid-January and late February 2026, particularly if prices reach the $4,700 to $4,800 region earlier in the year. This expectation aligns with the tendency for markets to digest gains after strong directional moves before determining the next trend phase.
- Overall, the chart emphasizes how repeating technical structures can provide context for potential price behavior. While gold has so far followed the initial path suggested by the December resolution, the coming months will be critical in determining whether the metal resumes a broader trend advance or transitions into a consolidation phase consistent with prior cycles. This projection is presented as a conditional scenario rather than a certainty and is derived from the magnitude of the prior move shown on the chart.
My Take: Gold’s current trajectory mirrors the August breakout remarkably well, and if history repeats, we could see significant upside through Q1 2026. However, traders should watch for consolidation signals around $4,700-$4,800 in late January or February before the next leg higher materializes.
Source: Rashad Hajiyev