
Silver Price Analysis: Momentum Builds After Multi-Year Breakout
- Trader UseliNk recently noted that “the daily long-term momentum is looking mighty strong still after its 5-year breakout,” highlighting silver’s ongoing bullish trend. The technical chart shows a clean break above a multi-year wedge pattern, with XAGUSD pushing decisively past upper resistance—confirming the metal’s upward trajectory.
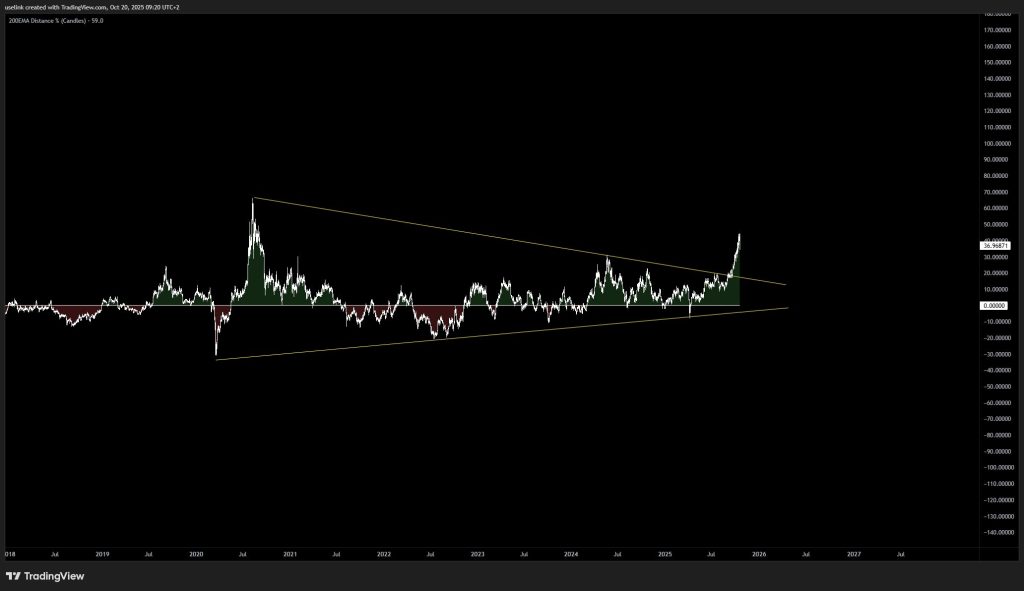
- For nearly five years, silver traded between roughly $10 and $30 per ounce, forming a tightening triangle before finally breaking out. This move hints at a shift in market sentiment, backed by stronger industrial demand, geopolitical tensions, and growing interest in hard assets as inflation concerns persist globally.
- While momentum stays solid, analysts warn that short-term pullbacks could happen as the market absorbs recent gains. Still, the fundamentals look supportive. The green energy transition and electric vehicle boom are driving steady industrial demand—especially for solar panels and batteries, both heavy users of silver.
- This rally matters beyond just price charts. Extended strength could lift silver miners and commodity-focused funds while reinforcing silver’s dual role as both an industrial metal and inflation hedge. Traders are watching resistance around $40–$45, where previous cycle peaks topped out.
- The breakout fits into a larger trend: investors rotating into tangible assets as central banks diversify and currencies face devaluation pressures. The chart structure suggests silver might be entering a phase that could challenge its multi-decade range—potentially elevating its status alongside gold as a store of value.


Pingback: Silver Price Forecast: Pullback Toward $44 Support - Finly.News