Gold Tests $5,000 Support After Bearish Week
Gold (XAU/USD) remains under pressure after a recent corrective move, with price now approaching one of the most important psychological levels on the chart. After reaching record highs earlier this year, the metal is now testing whether strong structural demand and technical support can prevent a deeper retracement.
Recent Price Action and Market Drivers
Gold prices ended the previous week on a weaker note, with XAUUSD trading near the $5,040 area following consolidation and short term bearish technical signals. The metal has faced pressure from shifting U.S. interest rate expectations, dollar strength, and mixed geopolitical developments, contributing to a recent pullback estimated at around 5%.
Despite the recent weakness, broader structural demand themes discussed in Gold breakout structure analysis continue to suggest that long term positioning remains supported by institutional flows and technical momentum cycles.
Key Technical Levels to Watch
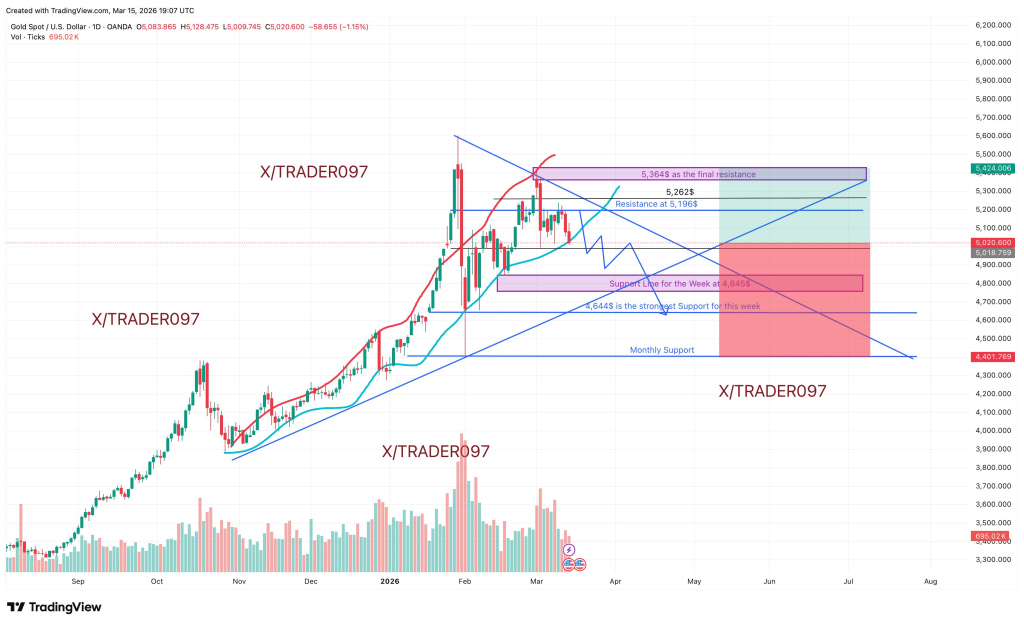
The technical chart shows gold trading near $5,020 while remaining below a descending resistance trendline formed after the recent peak near the $5,500 area. Key resistance zones appear near $5,196 and $5,262, while a higher resistance region around $5,364 remains a major upside barrier. On the downside, important support levels are located near $4,845 as a weekly support line and $4,644 as a stronger technical support zone. Meanwhile, the $5,000 psychological level continues to act as a critical short term pivot area.
Longer term demand dynamics outlined in Central bank gold accumulation trends also reinforce why major pullbacks often attract renewed buying interest from institutional participants.
Technical Structure and Elliott Wave Scenario
The technical structure referenced in the analysis suggests a possible Elliott Wave decline scenario if major support levels fail to hold. Under this framework, a completed five wave decline could potentially be followed by an A B C corrective recovery phase.
The chart also highlights moving average support and trendline confluence near current levels, reinforcing the importance of price behavior around the $5,000 region. Current consolidation behavior also aligns with patterns described in Gold trend continuation outlook where periods of compression often precede expansion in volatility.
Market Outlook
The current XAU setup shows how macro expectations and technical positioning remain closely connected in gold markets. With price trading near major technical levels, reactions around support and resistance zones may influence volatility and short term direction.
Recent technical behavior suggests that consolidation phases near major levels often act as decision zones where the next directional move begins to form.
My Take: The $5,000 level is more than just a number. It is a psychological line in the sand. If gold loses it convincingly, a deeper pullback toward $4,844 looks increasingly likely before any meaningful recovery attempt.
Source: Twitter Post by GOLD TRADER