
TSLA Stock Holds Ascending Triangle as $492-$506 Breakout Is Watched
- A recent technical analysis highlighted a developing structure in Tesla stock visible on the daily timeframe. TSLA has managed to stay within an ascending triangle pattern, prompting speculation about a possible breakout attempt. The attached StockCharts image supports this view, showing price consolidating beneath a horizontal resistance area while higher lows continue to form along an upward-sloping trendline.
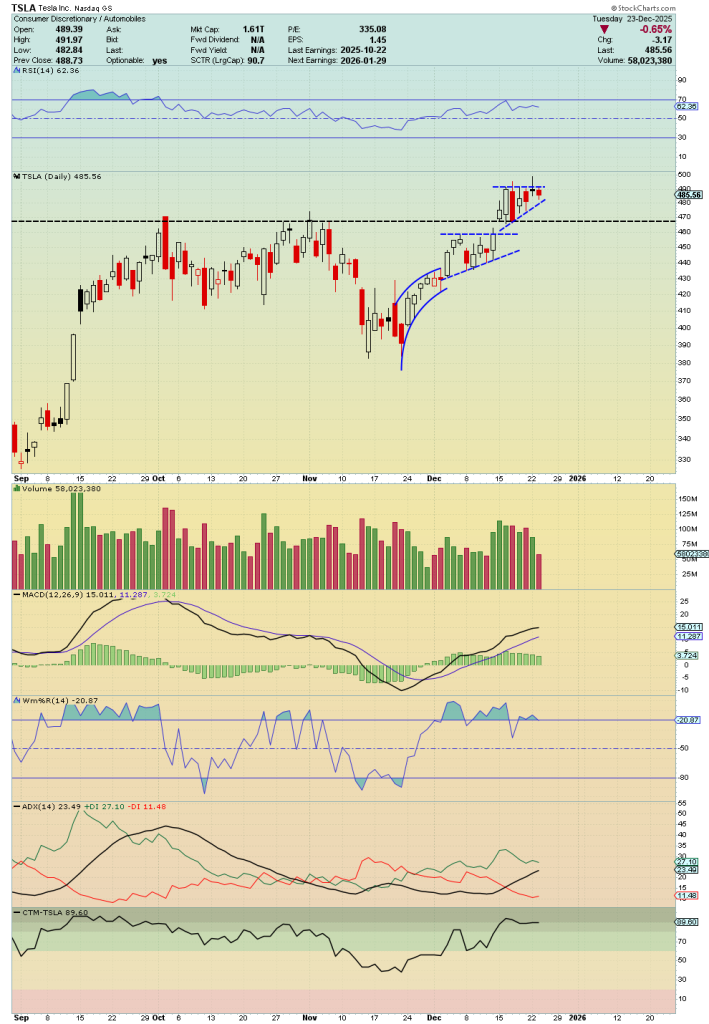
- The chart displays TSLA trading just below a key resistance zone near recent highs, with multiple candles compressing into a narrowing range. This structure reflects sustained buying interest at progressively higher levels, while sellers remain active near the same overhead price area. The tweet references potential levels around $492 and $506, which correspond to nearby resistance and commonly cited projection zones for ascending triangle patterns. However, the image itself does not confirm that a breakout has occurred.
- Momentum indicators shown on the chart provide additional context without signaling resolution. The RSI is positioned in the upper mid-range, indicating steady momentum but not overbought conditions. MACD remains positive, suggesting underlying trend support, while volume appears mixed and does not show a decisive expansion.
It managed to stay within the ascending triangle…. another b/o incoming soon? 492 506 incoming…..
- These elements are consistent with consolidation rather than a confirmed directional move.
- From a broader technical perspective, the chart shows TSLA stabilizing after prior volatility, with price holding above rising support. Ascending triangle formations are often monitored because they reflect tightening price action and growing pressure near resistance. Still, such patterns require a confirmed close above resistance to validate continuation, something not yet visible in the chart.
- As TSLA stock trades near the upper boundary of the formation, upcoming price action will determine whether the pattern resolves higher or continues to consolidate within the current range.
My Take: The ascending triangle on TSLA’s daily chart represents a classic consolidation setup with clear resistance near $492-$506. While the pattern suggests bullish continuation potential, confirmation through a decisive breakout remains essential before position entries.
Source: MentoviaX