
TSLA Prints Rare Reversal Candle as Tesla Closes Below 50-Day Average for Third Time
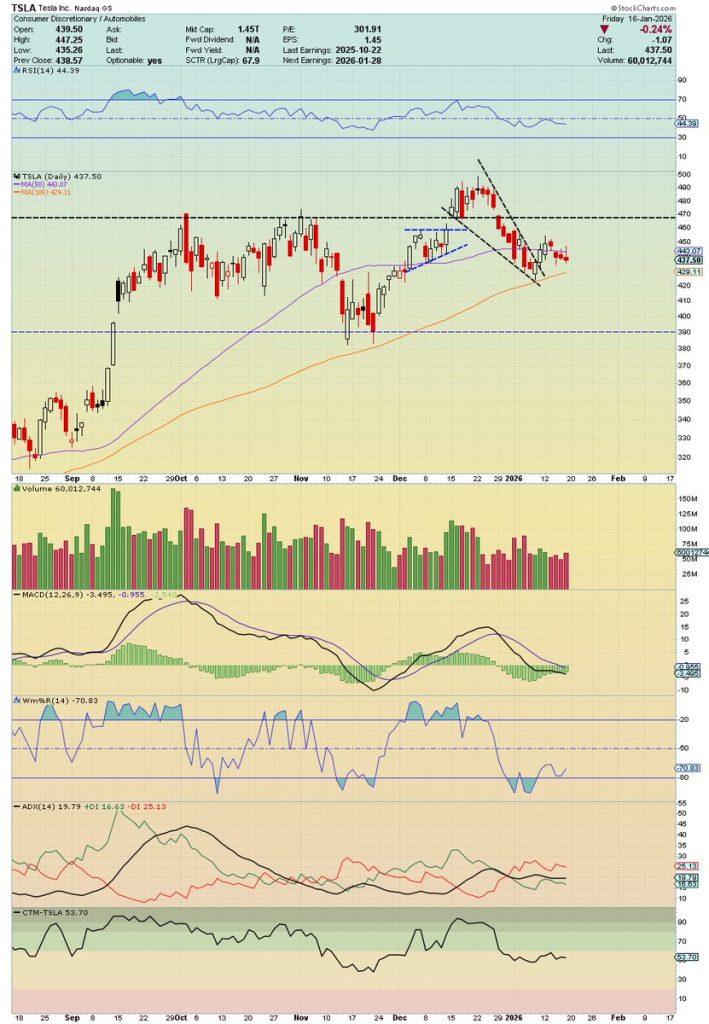
Tesla shares recorded a technically significant session that drew strong attention from traders. During the latest trading day, the stock printed only its second higher-high, lower-low daily candle of 2026, a rare reversal pattern. Despite early strength and a push to new intraday highs, the rally failed, with TSLA closing below its 50-day moving average on elevated volume.
This marked the third consecutive failure for the stock to reclaim that key technical level, reinforcing concerns that upside momentum is fading.
Key Technical Developments
Rare Reversal Candle
The daily candle structure clearly reflected a failed rally attempt. Buyers initially drove the price higher overnight and into the session, but selling pressure steadily took control as the day progressed. By the close, all early gains had been erased.
Notably, the only other occurrence of this pattern in 2026 resulted in a bearish engulfing candle, which was followed by further downside. The similarity between the two setups has raised caution among technically focused traders.
“This mirrors the first occurrence of such a candle earlier in 2026, which was a bearish engulfing pattern that led to further downside.”
Repeated Failure at the 50-Day Moving Average
Tesla’s inability to reclaim the 50-day moving average for the third straight attempt is a key signal. This level, often used as a gauge of intermediate trend strength, has repeatedly acted as resistance rather than support, suggesting sellers remain in control.
Options Market Signals
Options activity added further weight to the bearish setup. Ahead of the January 16 expirations, premiums were elevated, and bears used the strong open to sell short-dated puts—particularly at the 435 and 440 strikes. This positioning took advantage of premium decay and aligned with increased selling pressure in the underlying shares.
The convergence of bearish options flows and spot market selling reinforced the reversal signal seen on the daily chart.
Why This Matters
Tesla’s technical behavior often extends beyond the stock itself. As one of the most closely watched names in growth and technology, its price action frequently acts as a proxy for broader risk appetite.
Current chart signals point to weakening momentum across growth equities. Traders are now watching key technical zones closely:
- Support: 427–432 range and the 100-day moving average
- Resistance: 446–452 zone
With a shortened trading week ahead and Tesla China sales data expected soon, near-term moves in Tesla could influence sentiment across the wider market.
Outlook and Market Expectations
The next few sessions may prove decisive. A hold above support could stabilize price action, but a breakdown below those levels would increase the risk of accelerated downside. Upcoming macro catalysts and company-specific data may serve as the trigger for the next directional move.
Source: Killa