
ORCL Stock Price Prediction: Volatility Signals Key Setup
Oracle (ORCL) is approaching an important technical moment as volatility patterns begin to form on the weekly timeframe. Analysts monitoring the stock note that these formations often appear before significant price expansion phases. While the current structure does not guarantee a directional breakout, it suggests the stock may be entering a decision zone where the next major move could develop.
Key Technical Volatility Signals
Recent technical analysis highlights the emergence of so-called volatility holes on Oracle’s weekly chart. These patterns have historically appeared before notable price movements and are now drawing attention from traders looking for early signals of momentum change.
The chart shows two main signal types. Red ribbon volatility holes typically appear near local tops and may act as potential sell warnings. Blue ribbon volatility holes tend to form near potential opportunity zones where buying interest may start to build. The weekly structure shows these formations appearing repeatedly across previous market cycles.
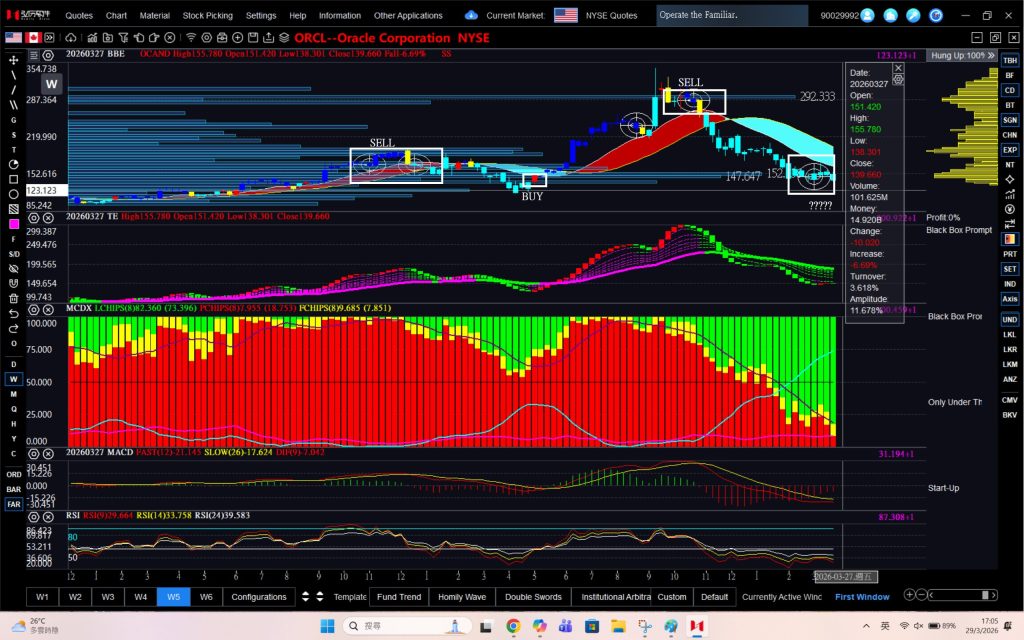
Historical Pattern Behavior
Historical observations suggest these volatility formations often appear approximately six to seven weeks before strong bullish candles develop. This timing relationship has made them useful as early timing indicators rather than precise directional signals.
“Volatility holes typically appear six to seven weeks before a strong bullish red candle appears.”
Based on past behavior, similar setups could eventually support renewed bullish momentum. However, this pattern does not guarantee a bullish outcome. Instead, it signals that Oracle stock may be approaching a period where volatility expansion becomes more likely following the current cooling phase.
Risk Factors and Market Context
The main risk associated with red volatility zones is their potential to indicate continued weakness or sideways consolidation if bearish pressure remains dominant. These signals may reflect profit taking or temporary trend exhaustion rather than immediate recovery conditions.
Because of this, these patterns should be viewed as timing tools rather than standalone buy or sell signals. Confirmation from price action and other indicators remains important.
Momentum Indicators and Broader Structure
The broader technical structure shows Oracle experiencing a strong rally followed by a corrective phase. This behavior is typical after extended advances as markets reset momentum before the next trend develops.
Momentum indicators including MACD and RSI currently show weakening strength after the previous peak. This supports the idea that consolidation could continue before a clear directional move forms. Volatility contraction phases like this often precede expansion phases in trending stocks.
Conclusion
Oracle’s current technical setup suggests the stock may be entering a critical phase where volatility expansion could define the next trend. While historical volatility patterns suggest the potential for renewed momentum, traders will likely watch for confirmation signals before positioning for a breakout.