Nvidia Rebounds After 7 Month Consolidation Phase
Nvidia (NVDA) is showing renewed technical momentum after more than seven months of sideways price compression. As of February 25, 2026, shares are trading at $196.72, up 2.01% on the session, as the stock rotates higher from a key technical support zone.
The move follows a rebound from the lower weekly Bollinger Band near $173.88, a level that has repeatedly acted as structural support during the prolonged consolidation phase. The reaction suggests renewed buyer interest at range lows just ahead of a potentially market moving earnings report.
With volatility likely to increase into earnings, the current setup places NVDA at a technically significant inflection point between continued range trading and a possible breakout expansion.
Technical Structure and Price Action
Seven Month Consolidation Range
The weekly chart highlights a prolonged consolidation phase lasting more than seven months. Since mid 2025, NVDA has traded within a well defined volatility envelope framed by 20 period Bollinger Bands.
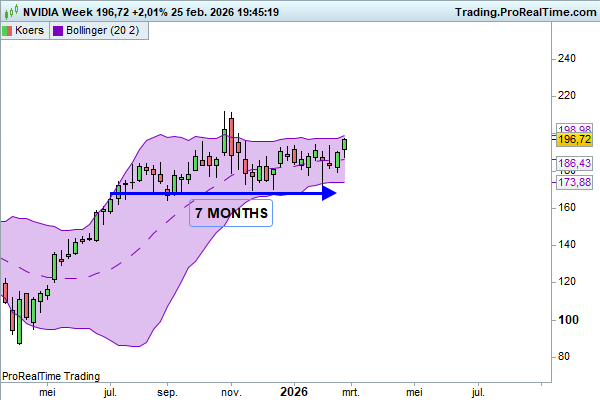
Price action has repeatedly respected both the upper and lower boundaries of this structure, reinforcing the sideways regime rather than confirming trend continuation. Such extended compression phases often precede expansion moves, but confirmation requires a decisive break of resistance.
Bounce From Lower Bollinger Band
Recently, NVDA rebounded from the lower weekly Bollinger Band near $173.88. From that level, price rotated toward the mid band around $186.43 and is now approaching the upper band near $198.88.
While constructive, this move does not yet qualify as a confirmed breakout. It remains a technical reaction from the lower boundary of a multi month range. However, after prolonged volatility compression, even internal rotations within the structure become technically meaningful.
As noted in the original market commentary:
“I don’t know how the earnings will land, but the stock has undergone a consolidation of over 7 months and has turned upward from the lower weekly Bollinger Band.”
Why This Setup Matters
Extended consolidation periods frequently serve as base building formations. The longer price compresses within a defined range, the more significant the eventual directional resolution can become.
For NVDA, the upper boundary of the range and the upper Bollinger Band now represent the critical technical threshold. A sustained break above that area would shift the structure from range rebound to breakout confirmation.
Until that occurs, the stock technically remains within consolidation, albeit with improving internal strength.
Outlook Ahead of Earnings
Earnings introduce an additional catalyst. Elevated implied volatility suggests the market is positioning for a potentially large move.
If NVDA decisively clears prior range highs and sustains trade above the upper Bollinger Band, the bullish case strengthens materially. Failure to do so could result in continued oscillation within the established channel.
At present, the chart reflects improving momentum but not structural confirmation.
My Take
The seven month consolidation indicates that Nvidia has been building a technical base rather than exhibiting distribution behavior. The rebound from the lower Bollinger Band is constructive and aligns with historical support behavior within the range.
However, confirmation remains essential. A breakout above the established upper boundary would provide stronger evidence of trend continuation. Until then, NVDA remains in a transitional phase between consolidation and potential volatility expansion.
Source: JDB