
NVDA Stock Drops Toward 200-Day MA at $175
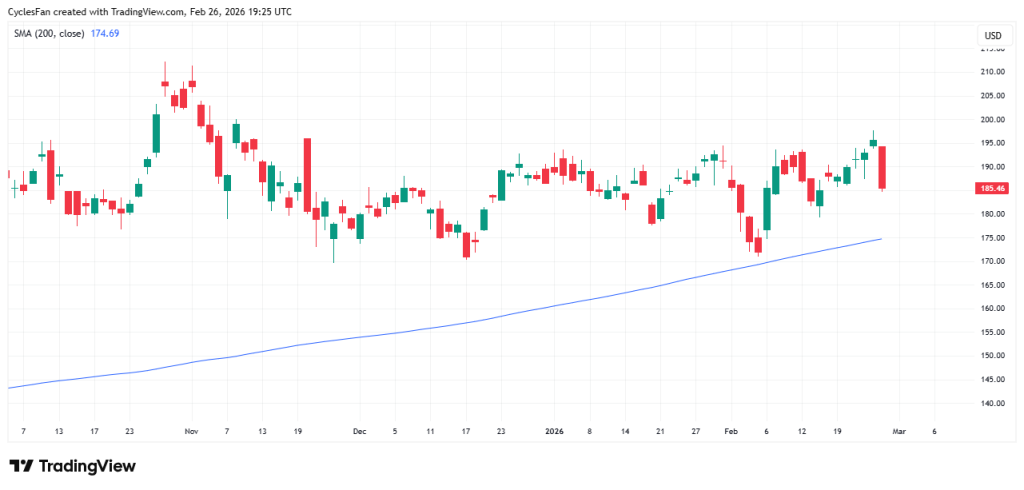
Shares of NVDA are facing renewed selling pressure as volatility increases across large-cap technology stocks during earnings season. The stock is currently trading around $185.46 and is moving closer to its 200-day simple moving average near $174.69. Market participants are now closely watching the $175 level as a potential downside target and technical support zone.
Recent Price Action
After weeks of consolidation between $180 and $195, Nvidia has started to pull back. Over recent months, the stock repeatedly moved within this established range, reflecting a period of balance between buyers and sellers.
However, the latest decline signals growing pressure, aligning with broader weakness seen across major tech names reporting earnings. As traders reassess valuations and guidance, the next key technical level stands out clearly on the chart.
Technical Focus: The 200-Day Moving Average
The 200-day moving average remains one of the most widely followed long-term trend indicators in the market. While NVDA still trades above this level, the gap is narrowing quickly as the pullback accelerates.
Historically, the $175 area has acted as an important technical reference point. If price continues to decline, this zone could attract buyers looking to defend the broader uptrend. A decisive break below the 200-day MA would suggest a shift in the medium-term structure, potentially opening the door for extended downside momentum.
Conversely, a strong bounce from this area would reinforce the longer-term bullish trend that has defined Nvidia’s performance in recent quarters.
Market Context
The current retreat in <a href=”https://finly.news/stocks/nvda-stock-analysis/”>NVDA</a> shares comes at a time when investor sentiment across big tech is highly sensitive to earnings results and forward guidance. As one of the leaders in the semiconductor and AI space, Nvidia often sets the tone for broader sector performance.
How the stock behaves near $175 may influence short-term direction not only for Nvidia but also for the wider semiconductor and artificial intelligence segment.
Outlook
The $175 level remains a critical technical threshold for bulls. Holding above the 200-day moving average would indicate that the broader uptrend is still intact despite near-term earnings-related volatility.
On the other hand, a confirmed breakdown below this level could trigger additional selling pressure and shift momentum bearish in the weeks ahead. Traders are likely to monitor volume and price reaction closely as NVDA approaches this key support area.
Source: CyclesFan