
NIO Stock Breaks $5.30 Resistance Level, Eyes $7.71 Target Zone
NIO Inc. (NIO) has returned to the focus of technical traders following a significant breakout that could signal a shift in the stock’s longer term structure. After spending several years in a persistent downtrend, recent price action suggests the early stages of a possible recovery phase if key technical levels continue to hold.
The move above resistance has triggered discussions about whether this breakout can maintain momentum. Similar recovery structures, such as the NIO institutional accumulation trend, show that confirmation through a successful retest often determines whether a breakout can develop into a sustained trend.
Technical Structure and Breakout Analysis
NIO shares attracted market attention after breaking above the important $5.30 resistance level on the two-week timeframe. This breakout could mark a structural shift if the former resistance successfully holds as support during a retest. Following the breakout, the stock has been trading near $5.84.
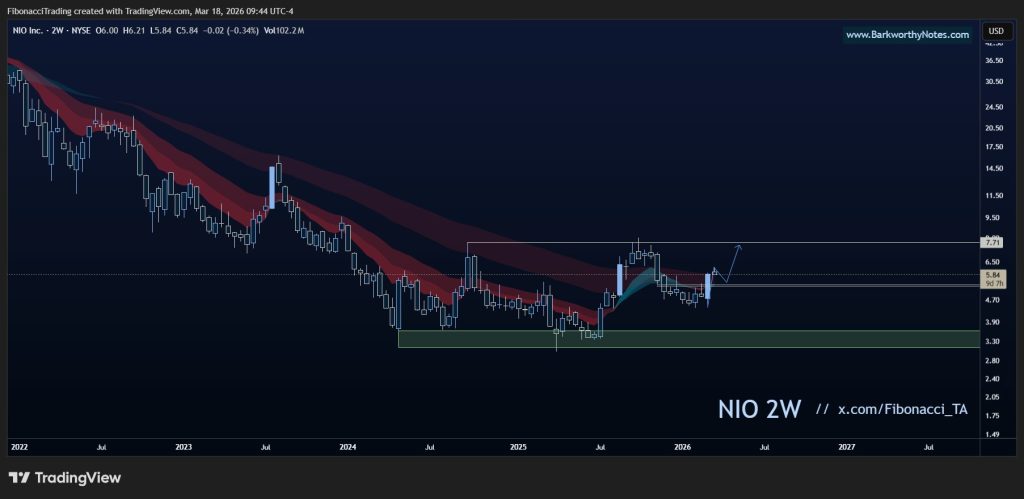
Looking at the broader structure, NIO declined steadily from 2022 through early 2025 before establishing a base around $3.30. After forming this bottoming structure, the price began to recover and eventually broke through the key $5.30 level.
Technical analysts suggest that a controlled pullback toward this zone could actually strengthen the bullish case. If buyers successfully defend the level, it would confirm a potential trend reversal similar to patterns seen in the NIO institutional accumulation trend, where continued buying pressure helped convert resistance into support.
Key Price Levels to Watch
A successful hold above the former resistance area could allow NIO to test the next major resistance near $7.71.
If the $5.30 level turns into confirmed support, the next technical upside target sits near $7.71. Current chart structure also shows a developing consolidation range between roughly $5.30 and $6.50, which may indicate the stock needs additional time to stabilize before attempting another upward move.
These breakout and retest dynamics have also appeared in other technical cases such as the Nvidia technical retracement outlook. In both situations, confirmation of support after a breakout played a key role in determining whether bullish momentum could continue.
Market Context and Technical Outlook
The current technical setup for NIO highlights how resistance breakouts and support confirmations often shape expectations following extended downtrends. The stock is now approaching an important technical decision zone.
Price action around $5.30 will likely determine whether the recovery structure continues to develop. At the same time, trader reactions near the $7.71 resistance area may show whether momentum is strong enough to support a broader recovery or if the stock remains within a consolidation phase.
Comparisons with structures like the Nvidia technical retracement outlook further demonstrate how critical these confirmation phases can be when defining medium term trends.
My Take
The breakout above $5.30 looks technically constructive, but NIO still needs to prove it can defend this level during a pullback. If support holds, the path toward $7.71 becomes technically justified. If the level fails, the stock could return to range bound behavior.
Trading volume will also be an important indicator to monitor, particularly during any retest of the breakout zone, as it may signal the strength or weakness of buyer conviction.
Source: Twitter post by Fibby