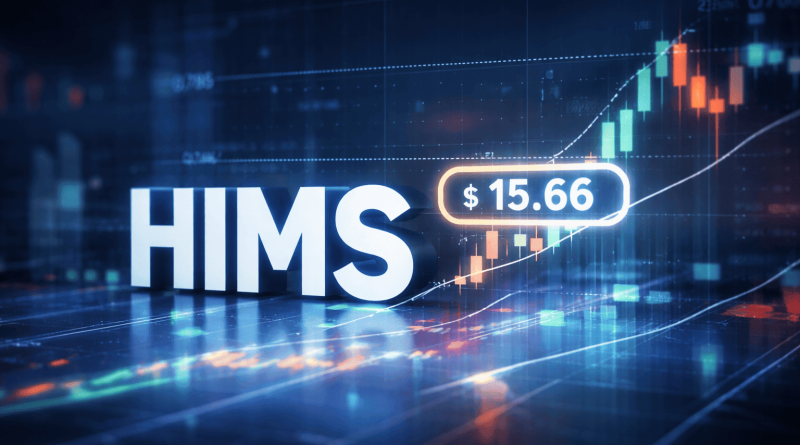
HIMS Stock News: 0.786 Fibonacci Level Tested at $15.66
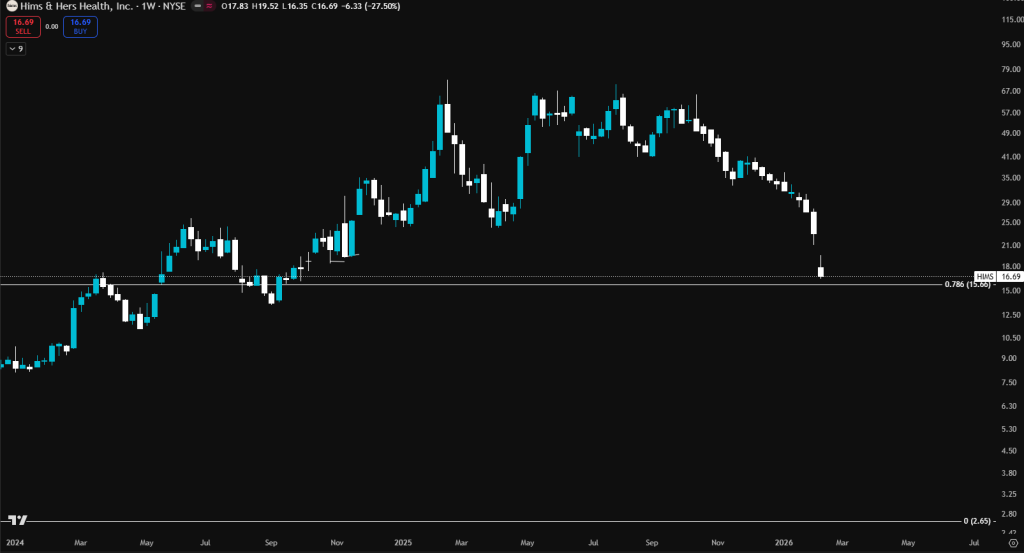
Shares of HIMS have reached a technically significant inflection point. According to a recent market update, the stock has pulled back precisely to the 0.786 Fibonacci retracement level on the weekly chart, aligning with support near $15.66.
This level is widely regarded by technical traders as a deep retracement zone that can either mark the final stage of a pullback within a broader bullish structure—or signal the beginning of further downside if it fails.
Key Technical Development
The 0.786 Fibonacci Retracement Test
After an extended decline from prior highs, HIMS has retraced to the 0.786 Fibonacci level with notable precision. The move into $15.66 reinforces the technical importance of this zone.
The 0.786 retracement is often considered the last major support within a corrective structure before either:
- A renewed bullish reversal
- Or a structural breakdown
The accuracy of this touch strengthens the case that market participants are closely watching this level.
Why This Level Matters
The 0.786 Fibonacci retracement frequently acts as a high-stakes support zone in trending stocks. Holding above it may indicate:
- Buyers stepping in aggressively
- Selling pressure exhausting
- Potential for renewed upside momentum
If the stock can maintain support at this level, momentum may begin to rebuild, potentially opening the path toward the $40+ range over time.
Risk Considerations
Despite the technical significance of the level, confirmation remains essential. A disciplined approach is necessary when trading near key support.
While it is generally risky to turn bearish directly at established support, price action must validate any bullish thesis. A failure to hold the 0.786 retracement could invalidate the setup and expose the stock to further downside pressure.
Outlook for HIMS Stock
HIMS now sits at a decisive technical juncture. If the 0.786 Fibonacci level holds, the setup could support a gradual rebuilding of bullish momentum, potentially positioning the stock for a longer-term move toward $40+.
However, without confirmation through sustained buying and higher highs, traders should remain cautious. The coming sessions will likely determine whether this retracement becomes a launching pad—or a warning signal.