HIMS Stock Bounces From $13 Low, Higher Low Pattern in Focus
Hims & Hers Health Inc. is drawing renewed attention from technical traders after a strong rebound from recent lows. The stock has shown early signs of stabilization following a sharp decline, but market participants are still waiting for confirmation that a true recovery trend is forming rather than a temporary bounce.
HIMS Stock Rebounds From Key Support
Hims & Hers Health Inc. caught technical traders’ attention after bouncing sharply from lows near $13.30. The stock closed around $24.38, printing a strong green daily candle that suggests buyers may be returning after the recent selloff. Despite this move, the recovery structure remains incomplete and requires further confirmation before a full trend reversal can be considered.
Key Technical Levels to Watch
The daily chart shows HIMS trading slightly above its 200 day moving average at $23.81, while still remaining significantly below the 50 day moving average near $41.86. This positioning reflects a market still in the early stages of potential recovery.
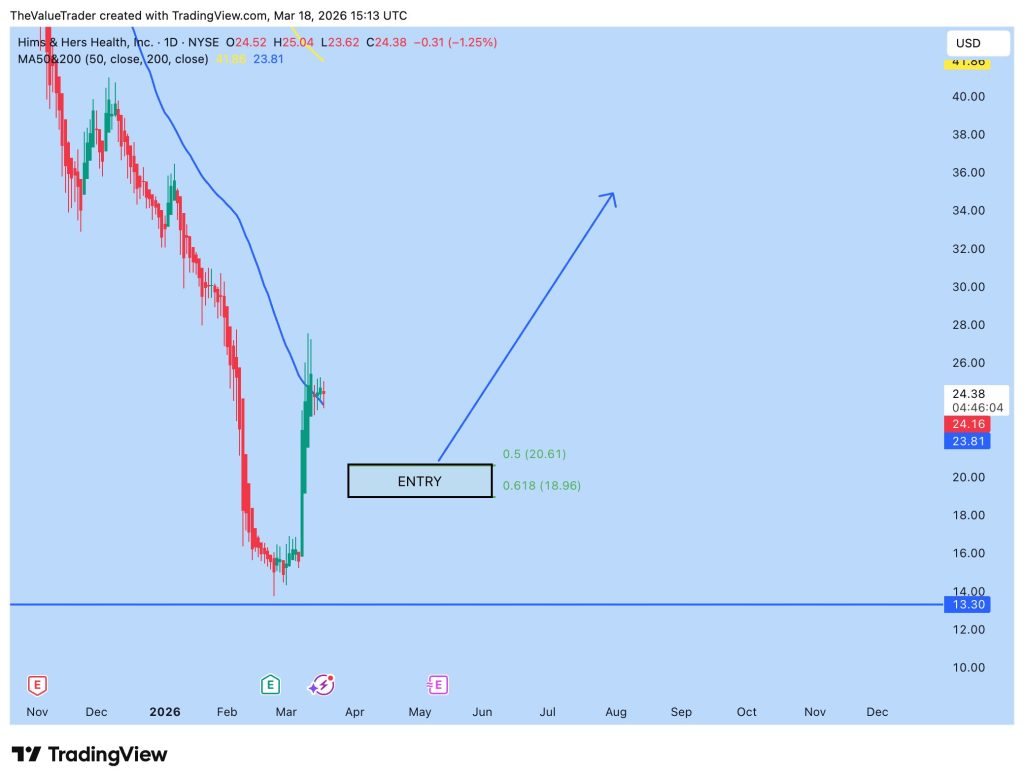
Key Fibonacci retracement levels are located at $20.61 and $18.96. These price zones could act as potential pullback areas where the stock might attempt to form a higher low. Establishing such a structure would be an important technical signal supporting the case for a more sustainable recovery.
Despite the recent upward move, confirmation of improving structure would depend on whether HIMS can form a higher low following a pullback.
Comparison With Other Recovery Setups
The current technical setup shows similarities to patterns observed in other recovery trades. NIO’s accumulation recovery structure demonstrated comparable bounce behavior following extended declines. IREN’s Elliott Wave rebound setup also highlighted how retracement zones can help validate possible trend changes. Nvidia’s recent $170 support test showed similar consolidation behavior after a sharp correction.
These comparisons illustrate how early recovery phases often require multiple confirmation signals before a clear bullish structure can develop.
Why the Next Pullback Matters
At the moment, HIMS appears to be at an important technical crossroads. The rebound from $13 support is encouraging, but without a controlled pullback and the formation of higher lows near Fibonacci support levels, the recovery thesis remains unconfirmed.
If the stock manages to hold above the $20 level during the next retracement and begins forming a sequence of higher lows, the technical outlook could shift more convincingly toward a recovery scenario.
My Take
HIMS still needs to prove the strength of this bounce through a proper technical retest. A rebound from $13 is only the first step. The real test will come if the stock can maintain support during the next pullback phase.
This is what typically separates sustainable recoveries from temporary relief rallies. The Fibonacci retracement zones will likely remain the key levels traders watch in the near term.
Source: Twitter Post by The Value Trader