
ASTS Stock Price Prediction: Pullback Signals Key Buy Zone
AST SpaceMobile stock is currently undergoing a technical pullback that may present a structured opportunity for traders looking for the next bullish continuation. Recent chart activity shows the stock approaching a historically significant support area where technical indicators suggest potential stabilization before the next move.
AST SpaceMobile Technical Analysis Shows Key Support Zone
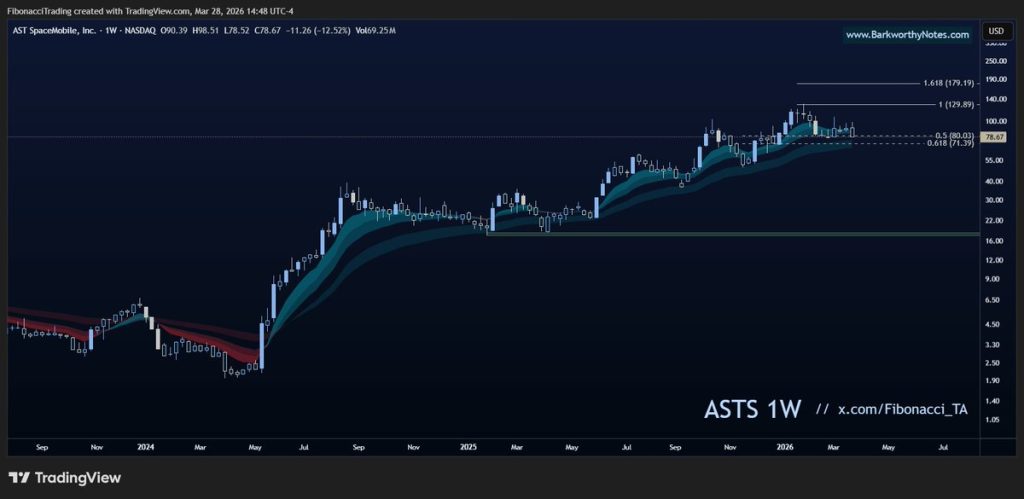
AST SpaceMobile is showing a structured pullback that could present a solid entry point for traders watching the stock’s next move. The current technical setup suggests a buy zone forming between $71 and $80, where key Fibonacci levels align with historical support.
This range matches the 0.618 and 0.5 retracement levels on the weekly chart, areas that have previously triggered buyer interest during past corrections. The stock has maintained a pattern of deep but organized pullbacks that consistently set up recovery rallies.
Fibonacci Levels Define Critical Price Structure
The technical structure remains intact as long as price holds above the $71 to $80 support zone. If this area breaks down, the bullish trend could weaken and potentially lead to a deeper correction phase. AST SpaceMobile has shown notable volatility in recent months, making precise entry timing important for risk management.
A similar technical structure was discussed in ASTS stock shows buy signal as 13HMA crosses 30HMA at $83.97, where moving average crossovers supported the continuation outlook. The analysis highlighted how trend confirmation signals can strengthen bullish scenarios.
Another comparable setup appeared in ASTS stock shows early bottoming signs at $78.40 rising support, where rising support levels indicated early stabilization signals during a prior consolidation phase.
ASTS Stock Price Targets If Support Holds
If the support range holds, the bullish scenario points toward upside targets near $129 and $179. These levels correspond to Fibonacci extensions visible on the chart and align with the stock’s established expansion pattern seen in previous rallies.
The alternative scenario involves a longer consolidation phase within the retracement zone if momentum slows temporarily. This would allow the market to build a stronger base before any potential breakout attempt.