
ASTS Reaches New Peak as 8% Rally Opens Path Toward $120 and $135
Shares of AST SpaceMobile (ASTS) surged roughly 8% in a single session, pushing the stock to a fresh all-time high. The breakout cleared long-standing resistance levels and placed the stock firmly into price discovery mode, a development closely watched by technical traders.
Key Market Developments
Price Action and Breakout
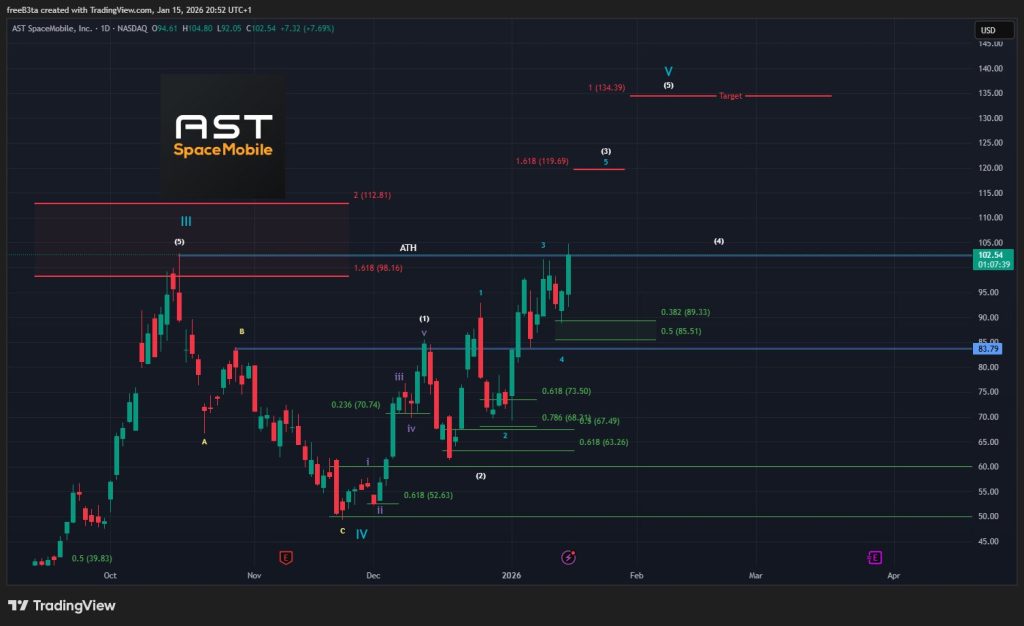
ASTS has been building a clean and consistent uptrend since late 2025, characterized by a series of higher highs and higher lows on the daily chart. The latest rally propelled the stock decisively above the $100 level, a price ceiling that had previously capped upside attempts.
With this resistance now broken, the stock has entered uncharted territory. Technical extension measurements from the breakout zone suggest $120 as the next logical upside target.
Technical Structure
Market analysis notes that once price moves above prior resistance, that level often flips into support if the trend remains healthy. Holding above the former $100 resistance zone will be critical in validating the breakout and sustaining bullish momentum.
As one technical assessment noted, once price clears historical resistance, the stock transitions into price discovery, confirming the formation of a new peak.
Why This Matters
New all-time highs often attract momentum-driven traders and algorithmic flows, particularly in high-growth and speculative technology names. As a result, breakouts like this can lead to increased volatility as both short-term traders and longer-term investors reposition.
ASTS’s performance may also influence sentiment across other innovation-focused and speculative growth equities. Sustained strength could reinforce risk-on behavior, while sharp reversals could have the opposite effect.
Outlook and Targets
If current momentum holds, a secondary technical target near $135 comes into focus. These levels are not driven by new company-specific news or fundamentals but are derived purely from chart-based projections.
The key factor going forward will be how the stock behaves around these projected levels. Consolidation above former resistance would support the bullish case, while failure to hold key zones could signal exhaustion.
Source: freeBeta