
Amazon Pullback Holds at 40% Breakout Zone as Monthly Bull Cycle Persists
Amazon.com Inc. (AMZN) is pulling back into a zone that’s historically been a sweet spot for accumulation. The Monthly BX indicator is still flashing bullish, even as the stock retreats from recent highs. The TrendSpider chart makes it clear—this pullback is happening within a broader uptrend, not a breakdown.
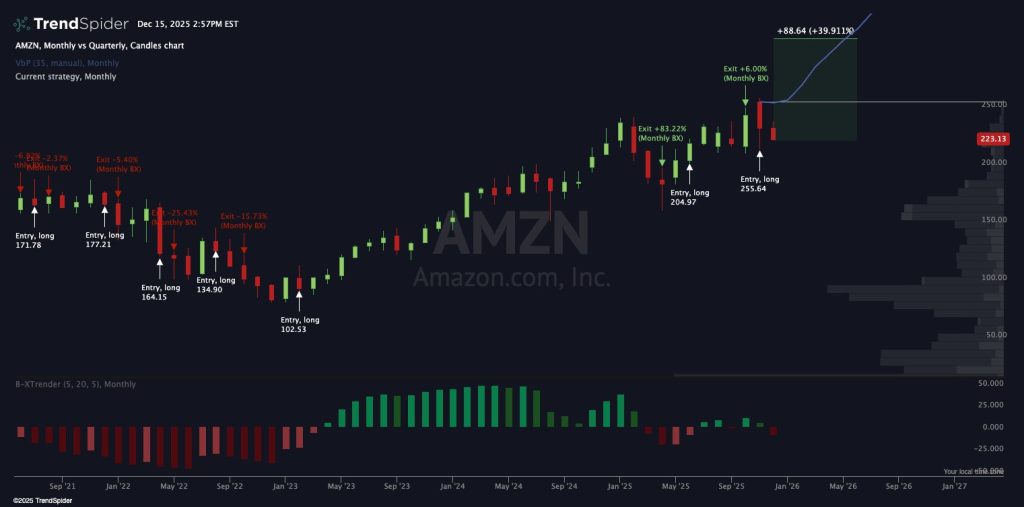
The monthly chart tracks AMZN’s steady climb from early 2023 through 2024, with multiple long entries and exits during previous BX cycles. Those earlier signals led to gains ranging from modest bumps to moves above 25 percent, showing the framework’s consistency. Right now, AMZN is back in discount territory, similar to zones that came before previous rallies.
“Historical data referenced alongside the chart suggests that comparable Monthly BX setups on AMZN have resulted in breakout moves of roughly 40 percent in about 47 percent of observed cases.”
The data shows that similar Monthly BX setups have produced breakout moves around 40 percent in roughly half the cases studied. The chart’s projected path points toward the $300 area over the next three to six months if the bullish cycle holds. Momentum readings under the price action look solid—selling pressure hasn’t taken over yet.
This matters for the broader market because Amazon is a massive piece of large-cap tech benchmarks and overall equity sentiment. When AMZN holds bullish long-term signals during pullbacks, it often lines up with strength in growth stocks. As long as the Monthly BX stays positive, this consolidation phase could shape where the market heads over the next few months.
My Take: Amazon’s current setup looks textbook for patient bulls. The 40 percent breakout potential in half the cases is compelling odds, especially with momentum still constructive. If AMZN can hold this discount zone while the Monthly BX stays green, we might be looking at a clean run toward $300 by mid-2025.
Source: Peter DiCarlo