
Stock Market News: SPX Rises 0.65% After Bullish Signal on January 23
U.S. equity markets opened January 23 with a constructive technical backdrop after ISABELNET’s Bull & Bear Indicator flashed a bullish signal before the opening bell. The signal aligned with market behavior during the session, as the S&P 500 advanced 0.65%, confirming improving short-term momentum.
Key Market Signal
Bullish Regime Identified Pre-Market
The Bull & Bear Indicator is designed to monitor internal market conditions in real time, classifying the environment as bullish, bearish, or neutral. Ahead of the January 23 open, the model shifted into bullish mode, suggesting that conditions favored upside exposure rather than defensive positioning.
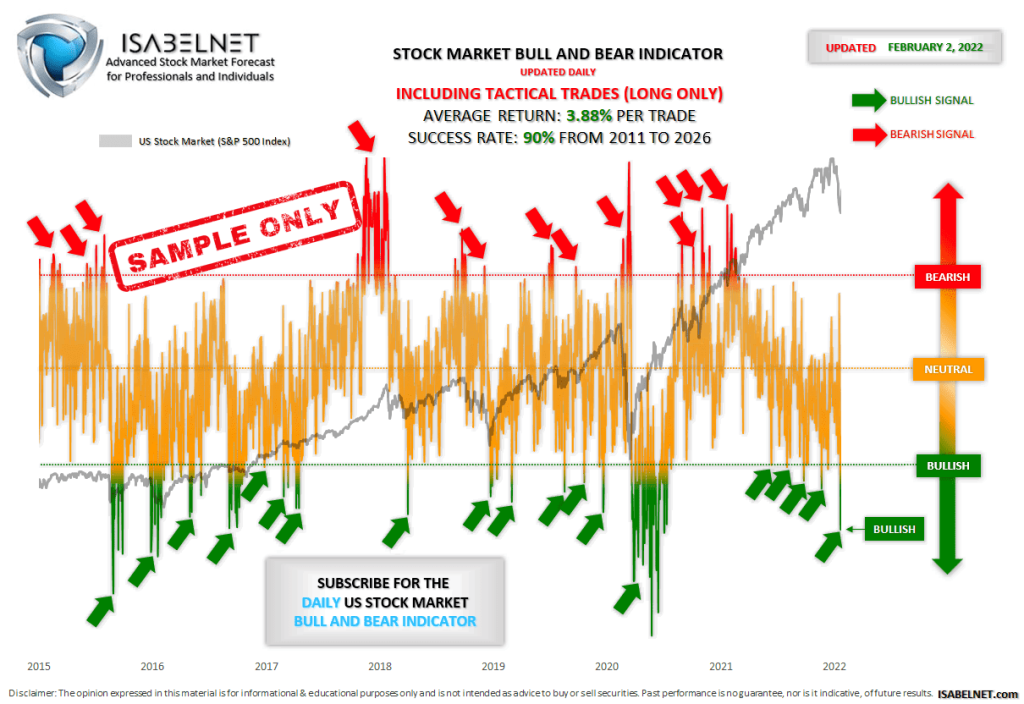
Unlike traditional forecasting tools, the indicator does not attempt to predict exact market tops or bottoms. Instead, it focuses on identifying the dominant market regime and aligning positioning with prevailing trends.
How the Indicator Works
Trend-Based, Not Predictive
The model continuously evaluates internal market data to determine whether conditions support risk-on or risk-off strategies. Its purpose is to help market participants remain engaged during favorable environments while stepping back during weaker phases.
As highlighted in the commentary, the indicator’s strength lies in its structured and consistent approach. By removing emotional or reactive decision-making, it provides a disciplined framework for interpreting market behavior.
Historical Context and Visual Signals
The indicator is updated daily and incorporates tactical signals designed primarily for long-only strategies. Visual markers identify historical bullish and bearish regimes, showing how changes in internal conditions have aligned with broader movements in the S&P 500 over time.
These regime shifts are intended to offer clarity during periods of uncertainty and heightened volatility, when directional bias is often difficult to assess.
Why This Matters
The market’s advance following the bullish signal reinforces the relevance of trend-based indicators in navigating equity markets. The ability to correctly identify favorable regimes can help investors manage exposure more effectively, particularly during transitional phases where momentum is shifting.
The January 23 session illustrates how internal market signals can provide actionable context without relying on precise price predictions.
Outlook
While no indicator guarantees future performance, the recent alignment between the bullish signal and the S&P 500’s gain underscores the value of regime analysis in assessing market momentum. As long as bullish conditions persist, the broader environment appears supportive of risk-on positioning, with trend tools continuing to play a key role in market interpretation.