
Russell 2000 Forms Head and Shoulders Pattern Near 2,634 Support, Raising Pullback Risk
The Russell 2000 is flashing early technical warning signals after its recent rally, as price action begins to form a classic head and shoulders pattern near key resistance levels. The setup suggests that upside momentum in small-cap stocks may be weakening following an extended advance.
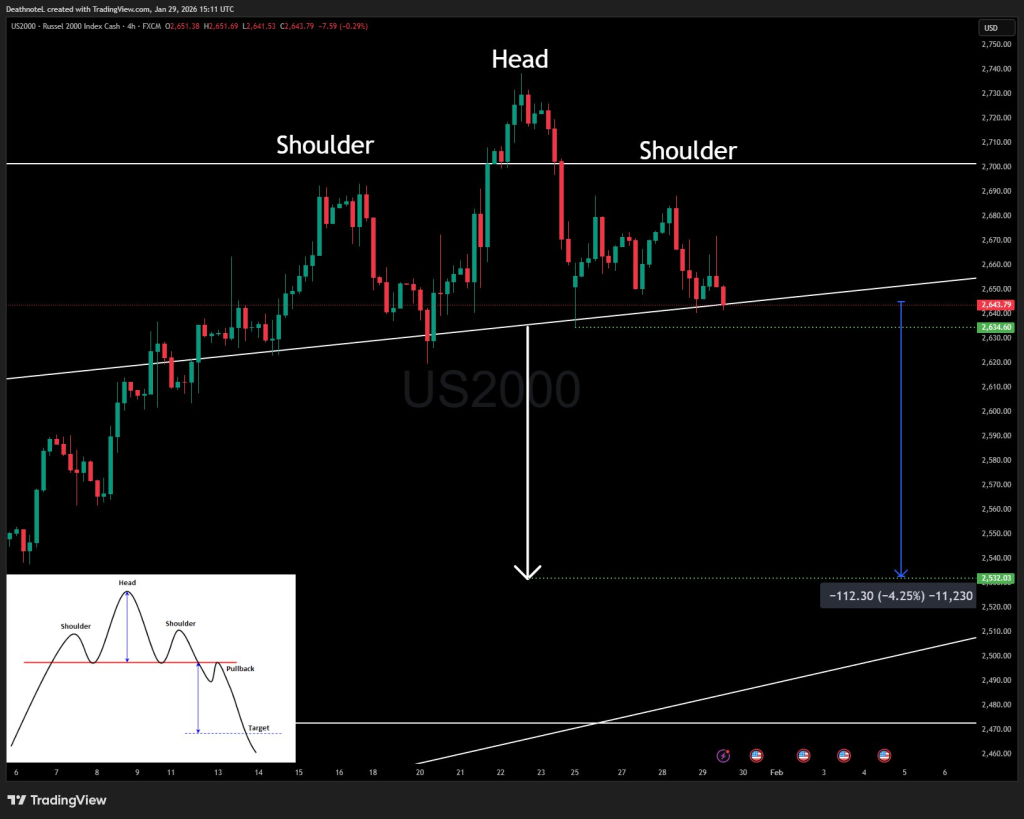
The pattern has emerged as the index stalled near elevated levels, with each subsequent push higher meeting resistance. Notably, the right shoulder is forming below the prior peak — a structure often associated with fading bullish momentum and growing downside risk.
With the neckline now positioned near the 2,634 level, the Russell 2000 is approaching a critical inflection point. A decisive break below this support would confirm the bearish formation and open the door to a potential move toward the 2,530 area, while a successful defense of the level could invalidate the setup and signal further consolidation instead.
Head and Shoulders Formation
The current chart structure displays a well-defined left shoulder, head, and right shoulder forming near elevated price levels. This pattern developed after the iShares Russell 2000 ETF (IWM) entered its initial Fibonacci price discovery zone, where upside momentum began to stall.
Importantly, the right shoulder is forming below the prior high, reinforcing the idea that buying pressure is weakening. Multiple attempts to push higher have been met with rejection, suggesting that buyers may be losing control after a prolonged rally.
Overbought Conditions and Resistance
Price action remains stretched, with repeated failures at resistance highlighting signs of exhaustion. While the broader uptrend remains intact, short-term momentum indicators point to increased vulnerability if key support levels fail.
As noted in the analysis, the formation of the right shoulder below the previous peak strengthens the bearish implications of the pattern and underscores the loss of upside momentum.
Critical Support Level at 2,634
The most important level to watch is the neckline near 2,634. This zone represents the boundary between consolidation and confirmation of the head and shoulders pattern.
A sustained move below 2,634 would confirm the bearish setup and project a measured move toward the 2,530 area. That target implies a potential pullback of approximately 4.25% from current levels and would likely bring price back toward the broader rising trendline rather than signaling a full trend reversal.
Why This Matters
The Russell 2000 is widely viewed as a barometer of risk appetite and domestic growth expectations. Weakness in small-cap stocks often reflects tightening financial conditions or declining investor confidence.
A confirmed breakdown below 2,634 could pressure small-cap equities in the near term and contribute to broader risk-off behavior across markets. Conversely, a successful defense of support would invalidate the bearish pattern and suggest the recent pullback is merely a pause within the prevailing uptrend.
Outlook and Market Implications
The index is currently at a technical crossroads. A break below support would likely lead to follow-through selling toward the 2,530 level, while continued support above 2,634 would point to consolidation rather than correction.
For now, the longer-term bullish trend remains intact. However, short-term traders should remain alert, as price action around this level will determine whether the current weakness develops into a deeper pullback or resolves as a temporary pause.