
NASDAQ Price Prediction: Index Tests 24,560 Support as March 2026 Volatility Increases
The NASDAQ slipped below the key 25,000 level and is now testing the 24,560 support zone as volatility intensifies in early March 2026. Traders are watching closely to see whether the index can stabilize or extend its recent decline.
NASDAQ Falls Below 25,000 as Selling Pressure Builds
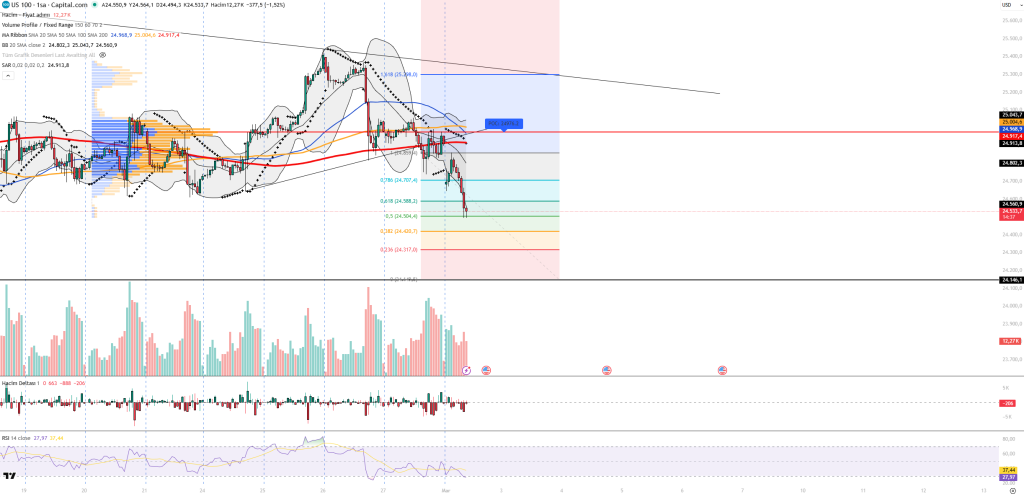
The NASDAQ index has decisively broken below the 25,000 psychological level, shifting focus to the 24,560 support area. The move comes amid rising volatility in early March 2026 and reflects growing downside pressure across technology and growth stocks.
With price now testing structural support, traders are closely monitoring whether buyers can stabilize the market or if the breakdown will extend toward lower technical targets.
Technical Indicators Signal Persistent Bearish Momentum
Momentum indicators suggest that sellers remain in control.
The Relative Strength Index is hovering near 28, placing the index close to oversold territory. While oversold readings can precede short term rebounds, there is currently no confirmed bullish divergence or reversal structure.
Volume expanded sharply during the selloff, indicating strong institutional participation rather than a shallow corrective move. Volume Delta remains negative, reinforcing continued seller dominance in short term positioning.
Price has also reached the lower Bollinger Band, reflecting extended weakness. Meanwhile, Parabolic SAR remains positioned above price, confirming that the prevailing trend still favors sellers.
Market Structure and Volume Profile
The Volume Profile identifies a Point of Control at 24,976. With price trading below this level, the market structure remains tilted to the downside.
As long as the index remains beneath the 24,976 to 25,043 resistance zone, short term recovery attempts may face renewed selling pressure.
Key Support and Resistance Levels
Support levels:
- 24,560
- 24,420
- 24,317
- 24,146
A confirmed break below 24,560 on a closing basis could accelerate downside momentum toward the lower support cluster.
Resistance levels:
- 24,917
- 24,976
- 25,043
- 25,298
A sustained move above 25,000 would be required to restore broader technical stability.
Macro Factors Increasing Downside Risk
Beyond technical signals, macroeconomic developments are adding pressure.
Rising geopolitical tensions between the United States and Iran have increased investor caution and supported flows into defensive assets. Higher oil prices are reinforcing inflation concerns, a dynamic that historically weighs on growth oriented equities.
Elevated bond yields and a firm US dollar are further tightening financial conditions, limiting the strength of potential rebounds in technology stocks.
Why It Matters
- A sustained break below 24,560 could trigger broader risk reduction across equity markets.
- Continued weakness in technology stocks may pressure broader indices.
- Failure to reclaim 25,000 would reinforce a short term bearish structure heading deeper into March 2026.
Outlook for March 2026
Technical damage from the recent breakdown appears substantial. Unless the NASDAQ reclaims 25,000 with sustained bullish momentum, the prevailing bias remains to the downside.
Short term traders should closely monitor price behavior around 24,560 for confirmation of stabilization or further decline. Longer term investors may wait for clearer structural reversal signals before increasing exposure.