
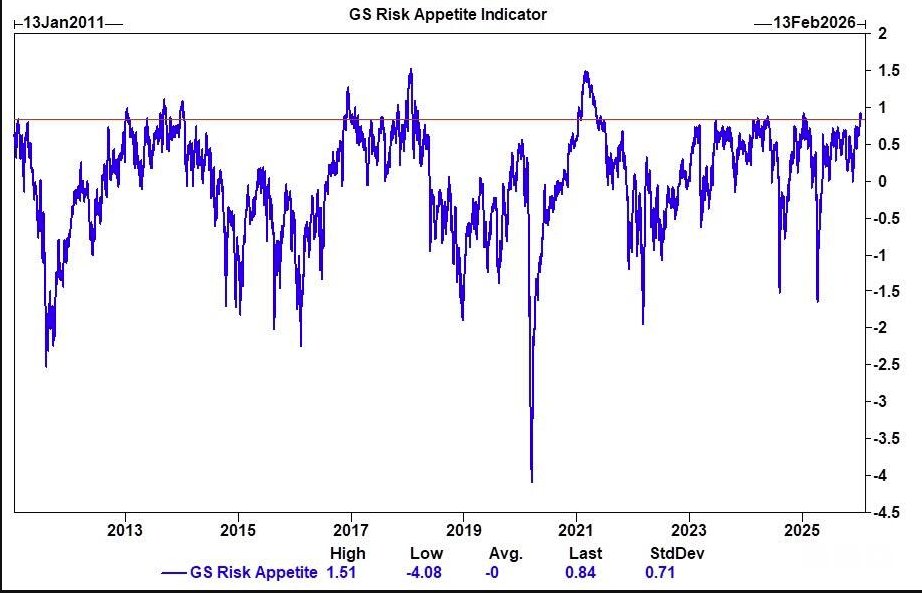
Goldman Sachs Risk Appetite Indicator Hits 96th Percentile in Early 2026
Markets opened 2026 on a strong optimistic note. Goldman Sachs’ Risk Appetite Indicator jumped to around 0.9, placing it near the 96th percentile of its long-term distribution. This level stands well above the historical average and represents the most bullish sentiment reading observed since 2025.
Key Indicator Readings
- The indicator’s move to the 96th percentile reflects a broad willingness among investors to take on risk.
- The current reading is among the highest of the past several years, signaling strong confidence rather than defensive positioning.
- Historically, such elevated levels are uncommon but not unprecedented during favorable macroeconomic phases.
What the Indicator Measures
The Risk Appetite Indicator goes beyond equity market performance. It captures investor behavior across multiple asset classes, highlighting periods when market participants favor higher-risk assets over defensive ones.
Importantly, past data suggests that extreme readings do not automatically signal an imminent market crash. Elevated risk appetite has often persisted for extended periods when economic and liquidity conditions remained supportive.
Historical Context and Market Behavior
When the indicator reaches extreme levels, market data shows that:
- Small pullbacks tend to occur more frequently.
- These pullbacks have usually been short-term corrections, not the start of major downturns.
- High sentiment alone has not historically triggered sustained bear markets, though it does increase market sensitivity to unexpected economic data or policy shifts.
Why This Matters
Investor sentiment plays a critical role in short-term price action and volatility. With risk appetite this elevated:
- Momentum can continue across equities, crypto, and other risk assets.
- At the same time, markets may become less forgiving if negative news emerges.
- Volatility can spike quickly as optimism leaves less margin for disappointment.
Outlook
With the indicator at these levels, the most likely scenario is continued market strength accompanied by periodic, shallow pullbacks. As optimism becomes stretched, reactions to macroeconomic surprises or central bank signals may become sharper, even if the broader trend remains constructive.
Source: Connor Bates