XRP Tests Critical 0.382 Fibonacci Support Level
XRP is currently trading near a crucial technical area as the price approaches the lower edge of its multi-month range. Market focus has shifted to a potential sweep of these range lows, which could pull XRP into what traders are calling an “area of interest” on the long-term chart. This zone lines up with the 0.382 Fibonacci retracement—a level that played an important role back in 2017.
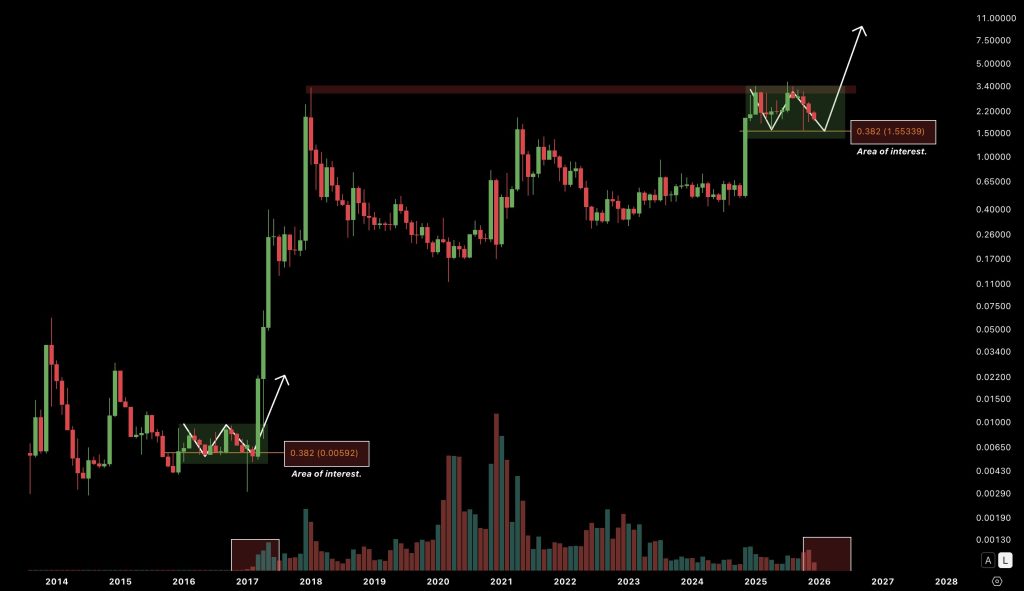
The chart shows XRP consolidating after weeks of sideways movement. The price sits above long-term support but still trades below a well-defined resistance zone. The 0.382 Fibonacci level stands out as the primary area where buyers might step back in if prices dip lower. Historically, this level acted as a stabilization point before strong upward moves in previous cycles.
Right now, support appears to be holding even as XRP trades near the bottom of its broader range. Technical analysts are calling this potential setup a “spring”—where price briefly drops into support before attempting to push higher again.
“Attention is centered on a possible sweep of range lows, a move that could bring XRP into a clearly defined area of interest marked on the long-term chart.”
This setup matters because XRP is approaching a historically significant price level that has influenced trend direction before. Whether it holds above this area or completes a deeper dip will likely determine short-term momentum within the ongoing consolidation. With XRP sitting right at a clearly marked support zone, how it behaves around the 0.382 Fibonacci level could set the tone for what comes next.
My Take: XRP’s approach to the 0.382 Fibonacci level is worth watching closely. If history offers any clues, this zone has proven meaningful before. Whether it acts as a springboard or gets tested further will tell us a lot about market conviction.
Source: ChartNerd