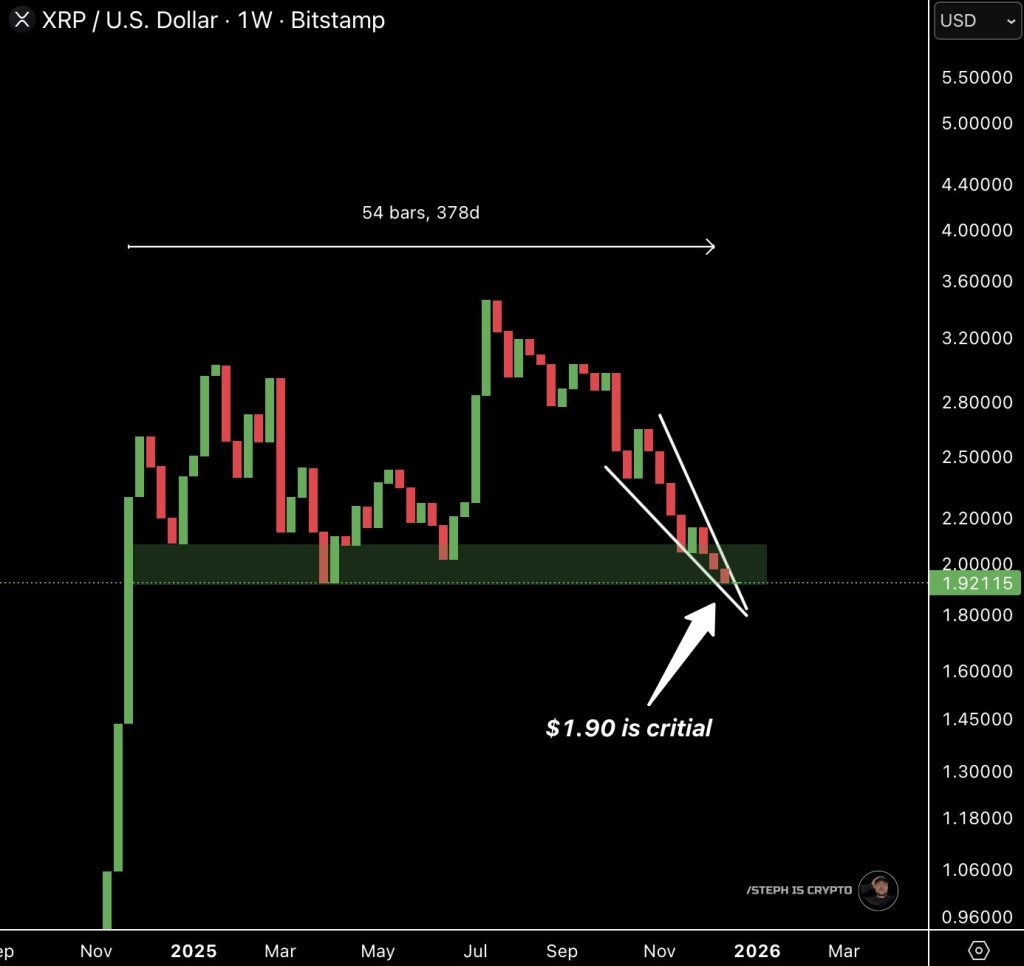
XRP Drops to $1.90 Yearly Support After 378-Day Range
- XRP’s Monthly RSI is currently resting near 54, approaching a region often associated with market resets and potential trend continuation. Pulling back to the 50 level after a strong uptrend typically means XRP is undergoing a temporary consolidation or healthy pullback within the existing bullish trend, emphasizing that the move reflects structural cooling rather than a breakdown of momentum.
- The chart illustrates multiple historical periods in which XRP entered what is labeled a “Dynamic Reset/Bullish Reversal Territory,” shown as a green band along the lower portion of each cycle. During previous cycles, as displayed around 2016, 2020, and the developing range into 2026, the RSI’s transition into this zone preceded significant upward expansions. These phases were marked on the chart by strong vertical reactions, signaling that the RSI reset acted as a foundation for renewed bullish pressure.
Pulling back to the 50 level after a strong uptrend typically means XRP is undergoing a temporary consolidation or healthy pullback within the existing bullish trend.
- XRP’s current decline toward this same zone reflects a pattern consistent with earlier consolidation phases where price paused before resuming its longer term trajectory. Broader context from the visual data shows that these RSI resets tend to occur during multi quarter rebalancing periods, where volatility decreases while trend structure compresses. The chart’s repeating formations indicate the presence of cyclical behavior, in which the RSI gravitates toward dynamic support levels before establishing the energy required for trend resumption.
- This behavioral pattern reinforces the idea that the current RSI positioning is part of a standard cycle rather than an early signal of deeper deterioration. The current situation appears as a constructive technical moment for the XRP coin, suggesting the market is preparing for its next directional phase. With the RSI compressing toward historically supportive territory, XRP continues to draw attention from those monitoring long term structural indicators frequently used in XRP price prediction and trend analysis.
My Take: The RSI pattern is compelling, especially given how cleanly XRP has respected this 50-level zone across multiple cycles. If history repeats, we could see significant upside once consolidation completes. Smart money watches these technical setups closely for entry points.
Source: STEPH IS CRYPTO