XRP Cycles Suggest Possible $0.73 Retest After Recent Peak
XRP is again attracting attention as technical analysts observe similarities between current price behavior and previous market cycles. Historical data suggests that after major peaks, XRP often enters corrective phases that bring the price back toward key regression channels. This repeating structure is now raising questions about whether XRP could revisit important technical levels in the coming months.
As traders evaluate the current setup, comparisons with earlier cycles may help define possible scenarios for XRP’s medium term price structure.
Historical Cycle Patterns Point to Familiar Structure
XRP is once again showing a technical structure that resembles patterns seen in earlier cycles. Historically, after reaching major local tops, the asset tended to retrace toward the upper Gaussian Channel within a period of roughly three months. Currently, XRP is trading near $1.45 after forming what appears to be another cycle peak.
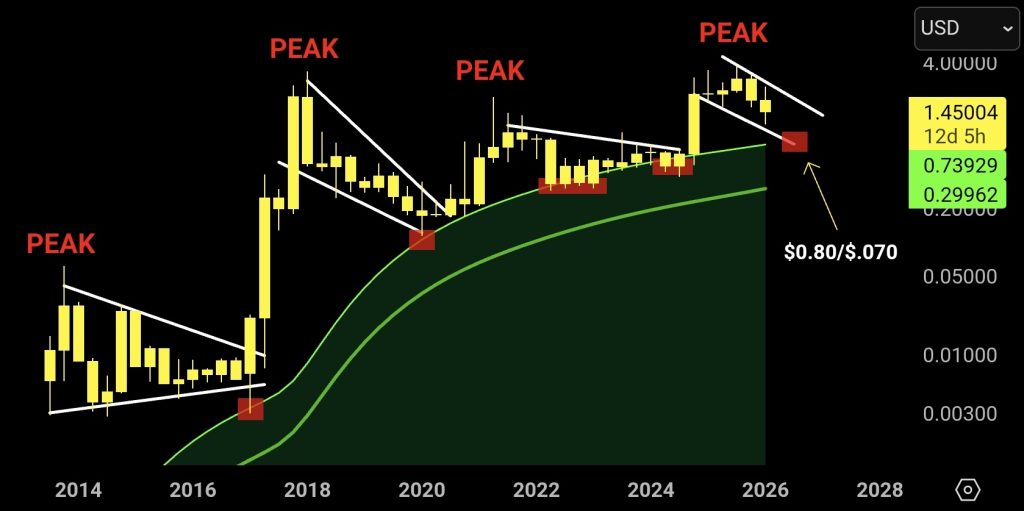
Analysis of the long term chart shows that previous XRP rallies were often followed by controlled corrections toward this regression band. The current technical formation appears to be developing in a similar way as price gradually moves lower following the latest high. Based on current regression levels, the upper Gaussian Channel is now positioned around $0.73, making it an important technical reference zone if the historical pattern continues.
After forming peak structures, price typically retraced toward the upper Gaussian Channel within approximately three months.
Gaussian Channel as a Technical Guide
Previous XRP corrections also demonstrate how dynamic regression channels can act as technical guides during market pullbacks. These structures often help traders identify potential equilibrium zones after strong price expansions.
Market observers frequently compare these setups with other technical situations such as XRP oversold recovery signals, Dogecoin breakout consolidation structure, and Cardano momentum recovery trend, where similar chart behavior has been used to assess possible continuation or correction scenarios.
Market Implications and Volatility Outlook
The current XRP structure shows how traders continue relying on historical cycle comparisons as part of broader crypto technical analysis. Price interaction with dynamic channel resistance and support levels may play a role in shaping XRP’s next directional move following recent highs.
Although the $0.73 level remains significantly below current price levels, XRP has historically shown the ability to move rapidly during both bullish and bearish phases. If the cycle pattern continues to develop as before, volatility could increase as traders begin positioning around the possibility of another interaction with the Gaussian Channel.
Recurring technical formations remain one of the key tools market participants use when evaluating volatility expectations and broader crypto market cycles.
Source: Twitter post by Hov