
Solana Rejected at $94 – Price Struggles Below $92 Resistance
Solana (SOL) is facing renewed selling pressure after failing to sustain its recent upside move. After approaching a critical resistance zone, the asset was rejected and is now trading back inside a broader consolidation range. This type of price behavior often signals weakening bullish strength and growing market indecision as traders reassess market direction.
The recent rejection highlights how important resistance zones continue to control short term price action. Similar market behavior was recently discussed in Bitcoin $65K support technical scenarios, where price remained trapped inside consolidation due to strong technical barriers.
Solana Faces Resistance After Recent Rejection
Solana is currently showing short term weakness after moving back below a critical resistance zone. The price failed to maintain recent highs and has now slipped into a structure that appears increasingly bearish. SOL remains positioned below an important resistance level while momentum continues to fade after the latest rejection.
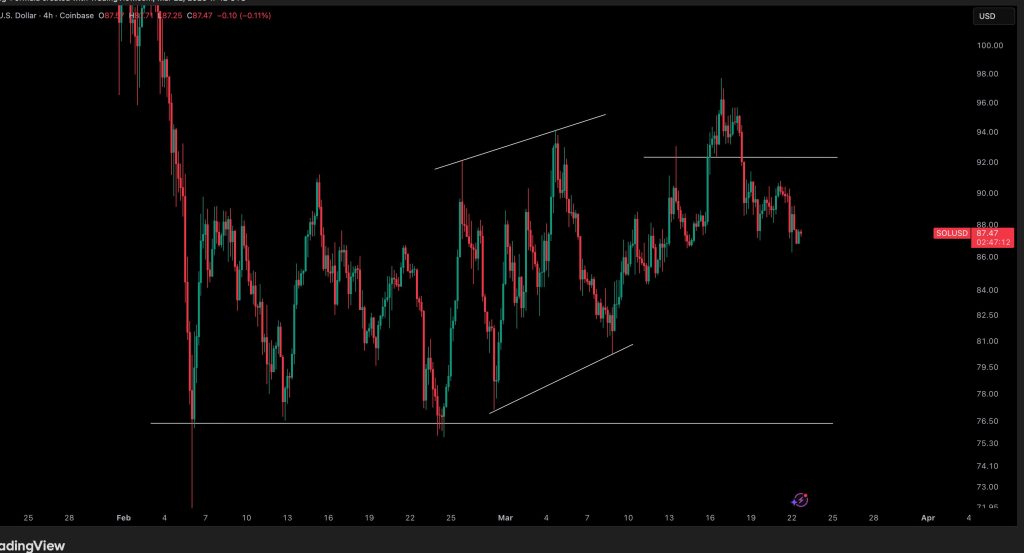
The chart shows SOL trading near $87 after being rejected from the $94-$96 region. The attempted breakout failed to hold, reinforcing the importance of the $92-$93 resistance zone. This area now continues to cap upside attempts.
At the same time, strong historical support remains near $76, a level where buyers previously stepped in to stabilize price action.
Rising Channel Breakdown Signals Momentum Shift
Before the rejection, SOL was moving inside a rising channel, typically viewed as a constructive bullish structure. However, the rejection near the upper boundary suggests buyers lost control of the trend. Following this move, price rotated back toward the middle of the range, often interpreted as weakening bullish momentum.
Similar technical behavior has appeared in other assets. For example, HIMS higher low pattern analysis showed how resistance rejection can quickly shift short term sentiment and interrupt developing uptrends.
The current structure suggests that unless buyers reclaim resistance, SOL may continue to experience range bound movement with downside risk increasing.
“The current chart structure suggests a bearish outlook as price continues trading below a key resistance level.”
Technical Structure Shows Key Decision Levels
The technical outlook becomes clearer when analyzing how SOL reacts near established boundaries. The asset previously advanced within a rising channel, but once price reached upper resistance, buying pressure was not strong enough to sustain a breakout. This failure altered the short term structure and introduced downside risk.
A comparable situation was outlined in NIO resistance breakout structure, where failed breakout attempts turned resistance zones into key technical reference points for traders evaluating trend strength.
SOL now remains positioned between overhead resistance and lower support. The next directional move will likely depend on whether buyers can reclaim resistance or if sellers push the price toward lower demand zones.
Key Levels Traders Are Watching
The $92-$93 resistance zone remains the most important level to monitor. A confirmed breakout above this area could quickly improve sentiment and potentially restart bullish momentum. However, continued rejection below this level keeps the bearish structure intact.
According to Sky, Solana’s rejection near $94 places short term control back in the hands of sellers. The $76 support zone now represents the next major downside test if selling pressure continues. Any recovery scenario would require a decisive breakout above $92 supported by increasing volume.
Source: Twitter post by Crypto Tony