HYPE/USDT Market Analysis
- The 4-hour chart shows HYPE trading sideways for weeks, with price stuck between clear support and resistance levels while liquidity accumulates.
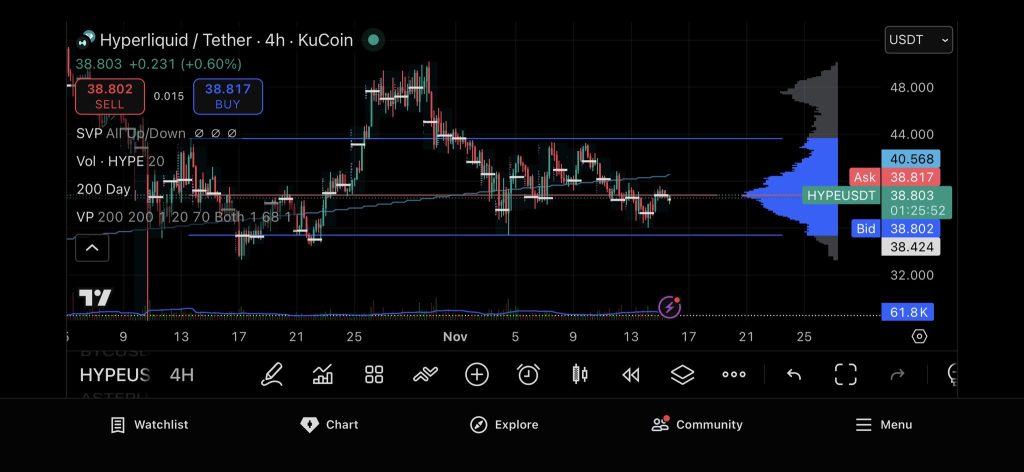
- The 4-hour HYPE/USDT chart on KuCoin reveals a prolonged accumulation pattern within a tight horizontal range. Price has been bouncing between support in the high-20s and resistance around the mid-40s, with multiple tests confirming both levels.
- Volume profile shows heavy concentration of trading activity throughout this range, signaling strong participation from both sides of the market. Despite several breakout attempts, HYPE remains locked in consolidation, suggesting participants are building positions rather than forcing directional movement.
- The 200-day moving average sits near the range midpoint, acting as a pivot and reinforcing the sideways action. Recent candles display tighter volatility and rotation around center levels—typical behavior when liquidity accumulates before a larger move.
- This multi-week setup reflects classic pre-breakout characteristics: stable volume, defined boundaries, and no clear trend. Traders typically watch these structures for eventual range expansion once momentum returns.
Source: Lennaert Snyder