
Ethereum Price Prediction: $2,140 Break or $1,930 Sweep
On the 4 hour ETH/USDT chart, price is consolidating inside a supply region where both buyers and sellers are positioning for the next move. Similar to the current structure seen in Bitcoin, Ethereum is trading at a level where traders typically wait for confirmation before committing to directional positions.
Liquidity currently sits both above resistance and below the nearby support zone, increasing the probability of a volatility expansion once price leaves the range.
Ethereum Tests Key Resistance Near $2,140
Ethereum is approaching a critical technical level as price tests the $2,140 resistance zone. Traders are closely watching this level because a breakout or rejection could define the next short term market direction.
On the 4 hour ETH/USDT chart, price is consolidating inside a supply region where both buyers and sellers are positioning for the next move. Similar to the current structure seen in Bitcoin, Ethereum is trading at a level where traders typically wait for confirmation before committing to directional positions.
Liquidity currently sits both above resistance and below the nearby support zone, increasing the probability of a volatility expansion once price leaves the range.
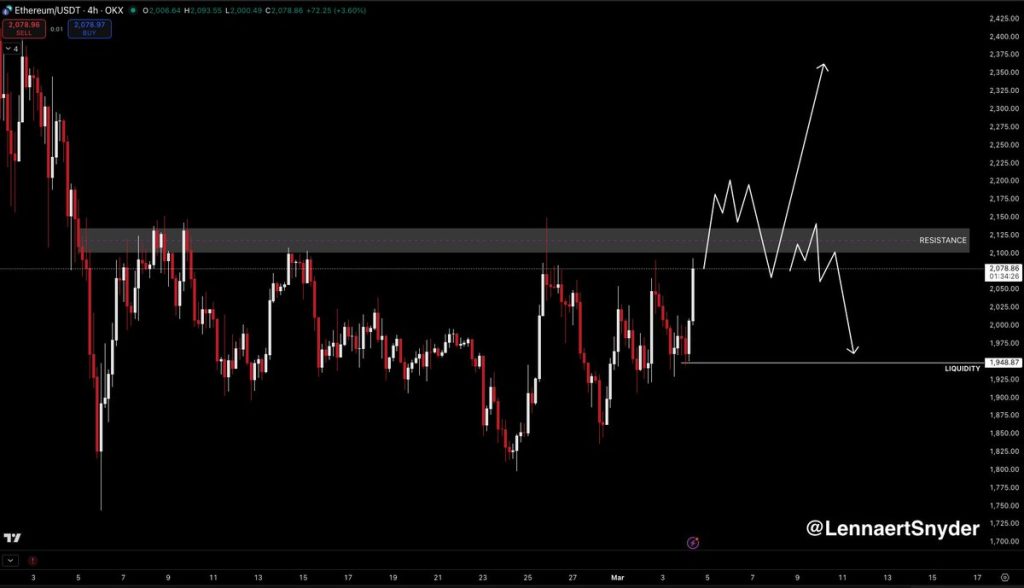
Bullish Scenario: Break Above $2,140
From a technical perspective, the $2,140 level represents the main trigger for bullish continuation. If Ethereum manages to break above this resistance and hold it as support, the market structure could begin shifting in favor of buyers.
In that scenario, traders often look for long entries on pullbacks after resistance flips into support. Sustained consolidation above the breakout zone would confirm that bullish momentum is returning to the market.
A confirmed breakout could also open the path toward higher liquidity zones. Analysts continue to highlight the remaining CME gaps near $2,300 and $2,700 as potential upside magnets where price may eventually move to rebalance market inefficiencies.
“$ETH trading scenario’s for this week are clear.”
Further analysis of similar technical structures can be seen in the article this Ethereum outlook, where traders are closely monitoring these higher liquidity levels and the possibility of price moving toward the CME gaps.
Bearish Scenario: Liquidity Sweep Toward $1,930
Despite the bullish potential above resistance, an alternative scenario remains possible if Ethereum fails to sustain the breakout. A move above $2,140 followed by a quick rejection could signal a liquidity sweep rather than a true breakout.
In that situation, traders may interpret the move as a trap for late buyers. Once a bearish market structure break occurs, short positions could become more attractive as momentum shifts toward sellers.
The primary downside target in this scenario sits near the $1,930 range low. This area represents a significant liquidity pocket where previous consolidation took place and where resting orders may still be located.
Market participants have observed similar reactions before when Ethereum struggled to hold key support zones. A recent example occurred when ETH tested the $1,957 support level, where continued selling pressure opened the door for a potential move toward $1,866. A full breakdown of that setup can be found in the analysis titled this Ethereum technical analysis, which examines the previous support test and the downside targets that followed.
Why This Level Matters for Ethereum Traders
The current price structure places Ethereum inside a clearly defined trading range between resistance near $2,140 and support around $1,930.
Ranges like this often function as accumulation zones where larger market participants gradually build positions before a stronger directional move occurs. Historically, extended consolidation periods inside tight ranges tend to lead to higher volatility once price finally breaks out.
The setup also resembles previous market structures where Ethereum interacted with the $2K to $2.2K weekly demand zone. During those phases, price consolidation was eventually followed by a bounce as buyers returned to the market.
For now, Ethereum remains at a classic decision point where traders are waiting for confirmation before taking aggressive positions.
What Could Happen Next
Ethereum may continue trading inside this range until a decisive breakout occurs. The $2,140 resistance level has rejected price multiple times, meaning a successful breakout would likely require strong volume and sustained momentum.
If price fails to hold above resistance and the breakout turns out to be false, a rapid move toward the $1,930 liquidity zone could follow as downside orders are triggered.
Until one of these levels breaks, many traders prefer to remain reactive to key price levels rather than committing to a fixed directional bias.