
ETH Price Approaches Critical $2,600 Support as 200 EMA Test Looms
- Ethereum is facing a pivotal technical moment as price action moves closer to a major long-term support indicator. CryptoPulse recently highlighted that ETH is approaching a key 200 EMA test, with broader altcoin momentum starting to weaken. The TradingView chart shows Ethereum on the weekly timeframe pulling back toward the rising 200 EMA after a strong advance earlier in the cycle.
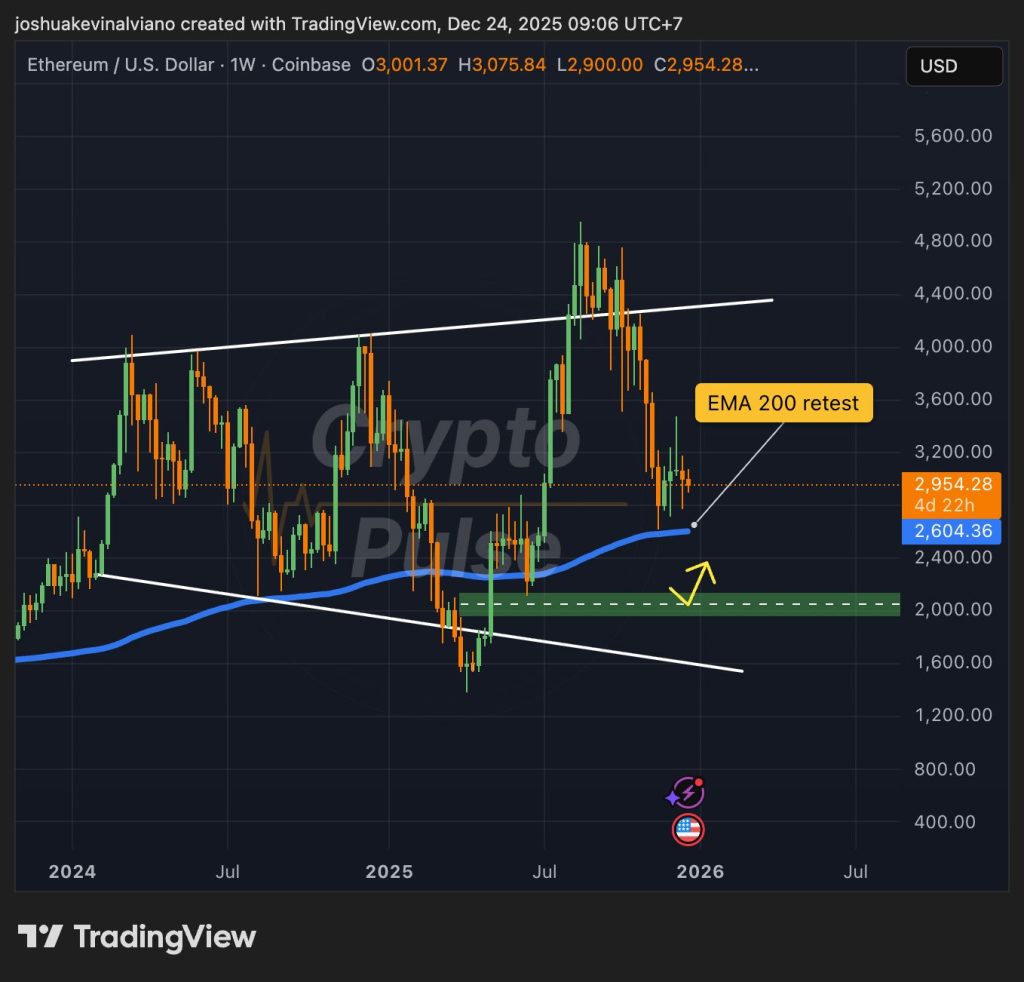
- The chart illustrates Ethereum previously breaking higher from a long-term range before facing resistance near the upper trendline. Since that rejection, price has declined sharply and is now trading near the 200 EMA, which is visually marked around the mid-$2,600 level. This area is highlighted as a critical retest zone, reflecting its role as structural support rather than a short-term trading level.
ETH approaching a key 200 EMA test. Losing it increases the likelihood of a move toward the $2,000–$2,100 monthly fair value gap.
- A strong bounce from the 200 EMA would help maintain Ethereum’s broader market structure. Historically, this moving average has acted as an important support during corrective phases, helping define higher-low formations in longer-term trends. Holding above the 200 EMA would suggest that Ethereum’s recent pullback remains a correction within an existing structure rather than a full trend reversal.
- However, the chart also outlines a clear alternative scenario if support fails. A loss of the 200 EMA increases the likelihood of a deeper move toward the $2,000–$2,100 region. This zone is marked on the image as a monthly fair value gap, indicating unfinished price action from earlier in the cycle. The highlighted area represents a potential downside target rather than a guaranteed outcome.
- As Ethereum trades near this critical support, upcoming price behavior around the 200 EMA is expected to play a central role in shaping near-term market sentiment.
My Take: This 200 EMA test could define Ethereum’s trajectory for the coming weeks. A bounce here keeps the broader bullish structure intact, while a breakdown opens the door to significantly lower prices. Traders should watch volume and momentum closely at this level.
Source: CryptoPulse