
Dogecoin Price Prediction: Echoes of 2017 as DOGE Builds for a Major Rally
As crypto markets settle into a quieter rhythm, Dogecoin’s long-term chart is showing something interesting—a familiar pattern of accumulation that mirrors what happened right before its legendary 2017 surge.
The Pattern That’s Hard to Ignore
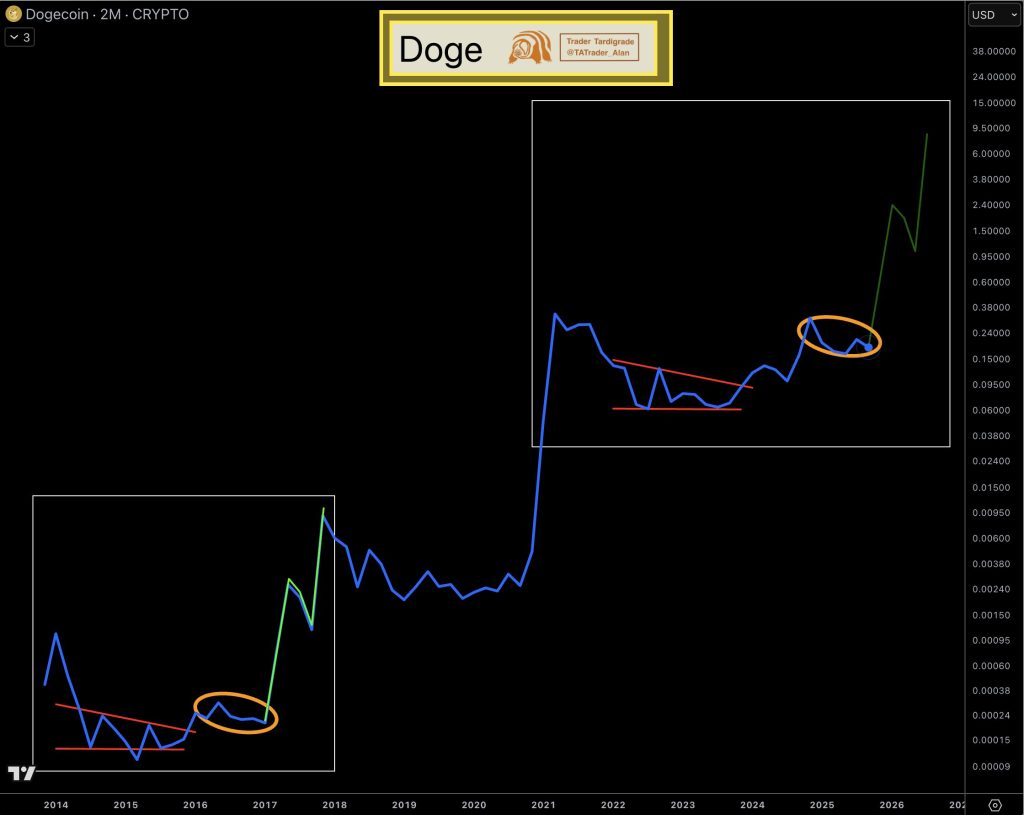
Veteran trader Trader Tardigrade recently shared a two-month DOGE chart pointing out the eerie similarities between now and then. The setup suggests that what looks like boredom today could turn into fireworks tomorrow.
Dogecoin’s chart tells a story in two acts, separated by nearly a decade:
2014–2017: DOGE spent over two years trading sideways with declining highs and steady support, forming a tight wedge before exploding upward. The base-building was slow and boring—until it wasn’t.
2022–2025: The same structure is playing out again. A descending resistance line (marked in red on the chart) is pressing down on price while a horizontal support zone around $0.06–$0.08 holds firm. The result? A compression zone that looks almost identical to the pre-2017 setup.
Both phases are circled in orange on the chart, highlighting the near-perfect symmetry. Support has been rock-solid between $0.06 and $0.08 for nearly two years, while resistance around $0.20–$0.25 keeps getting tested but hasn’t cracked yet. When price finally breaks out of this squeeze—as the green arrow on the chart suggests—it could mirror 2017’s parabolic move.
This kind of tight-range action is classic accumulation territory. When volatility compresses this much, big moves usually follow.
Why This Time Could Be Different (But Also the Same)
Dogecoin’s long consolidation is happening as institutional interest in crypto picks up again and analysts talk about a new market cycle taking shape. Historically, DOGE tends to explode during euphoric phases when retail traders pile in—often lagging behind Bitcoin before entering its own speculative frenzy.
Back in 2016–2017, DOGE was trading near $0.0002 before launching over 100x within a year. The recipe was simple: a long accumulation base, a sudden volume spike when resistance broke, and a bull market backdrop. Today’s chart shows the same quiet setup—the kind that’s preceded Dogecoin’s biggest runs in the past.
What to Watch
- Support: $0.06–$0.08 (the foundation of this multi-year base)
- Resistance: $0.20–$0.25 (break this, and things could get wild)
- Big Picture Targets: $0.80–$1.00+ if the cycle extends
Short-term chop is still possible, but the longer-term setup suggests patience might pay off—again.
Dogecoin’s two-month chart is flashing a signal that’s hard to ignore. The same accumulation-and-breakout pattern that launched DOGE’s 2017 rally seems to be forming again, complete with the same compression, resistance structure, and coiled-up energy.
If the pattern holds, Dogecoin’s next move could be a big one—and it might just reignite the retail frenzy that made DOGE a household name in the first place.
For long-term holders, this quiet phase might not be boring at all. It could be the buildup before another historic run.