BTC Trades Below $106,751 SMA200 as $100K Q1 2026 Rally Looks Likely
- Bitcoin is currently trading below a closely watched technical benchmark—the 200-day simple moving average, which sits at $106,751. Right now, BTC is hovering around $90,000, keeping it well underneath this long-term trend indicator. The last time Bitcoin touched the SMA200 during a downturn was back in 2022, and the selloff didn’t stop there—it kept going.
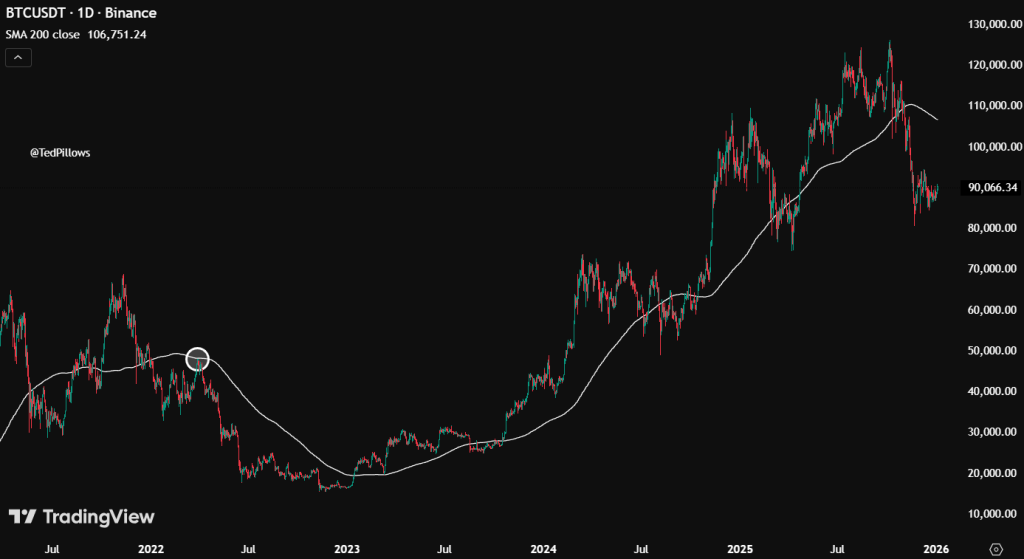
- The 200-day moving average is a go-to tool for traders trying to figure out where the market’s headed over the longer haul. With BTC still trading below it, the SMA200 is acting more like a ceiling than a floor. The current chart mirrors what happened in 2022, which is why some traders are paying extra attention to this setup.
BTC previously touched this level in 2022 while already in a downward trend, and the decline continued afterward.
- But here’s the interesting part: even though Bitcoin is sitting below this key level, there’s growing confidence that it could push above $100,000 during the first quarter of 2026. After years of big gains followed by some sideways price action, the SMA200 at $106,751 is sitting right near that psychologically important $100K mark.
- This positioning matters because traders often use Bitcoin’s relationship with the SMA200 to get a read on overall market sentiment. Whether BTC stays stuck below this line or breaks back above it could make a real difference in how people feel about the asset heading into spring.
My Take: The 2022 comparison is worth noting, but Bitcoin’s fundamentals look different now. If BTC reclaims the SMA200, it could trigger momentum buying. The $100K target feels realistic given the current consolidation pattern and historical post-halving cycles.
Source: Ted